Our principal operating regions—Yamaguchi, Hiroshima, and Fukuoka prefectures—are home to diverse natural capital, including rich marine resources along the Sea of Japan and the Seto Inland Sea, extensive mountain forests, and rivers and wetlands. These natural assets are deeply connected to local industries and communities.
These natural assets provide a wide range of ecosystem services that support our lives and economic activities, including climate regulation, water supply, soil conservation, and the provision of habitats for biodiversity. However, in recent years, the degradation of natural capital and the loss of biodiversity have become increasingly serious due to the impacts of human activities, such as climate change, changes in land use, and excessive resource use. As a result, there is growing demand for corporate action to address these issues.
As a regional financial group, we believe we have a responsibility to actively contribute to the conservation and restoration of natural capital. Based on this recognition, we pursue management in harmony with nature.
In the YMFG Medium-Term Management Plan (FY2025–FY2029), we have identified “addressing emerging environmental and social challenges” as one of our key sustainability priorities. Since FY2025, we have been strengthening our initiatives to address natural capital and biodiversity.
The Group became a member of the TNFD Forum* in May 2025.
- TNFD Forum: An international organization that supports discussions under the TNFD framework by bringing together stakeholders that contribute expertise.

Going forward, through our participation in the TNFD Forum, we will access international discussions and the latest insights on natural capital. Based on this, we will develop a foundation for promoting effective initiatives as a regional financial group, while enhancing our nature-related disclosures.
In preparing this disclosure, we assessed dependencies and impacts and identified risks and opportunities in priority sectors (the “priority sectors”) with advice and support from MS&AD InterRisk Research & Consulting, Inc.
As a financial services provider, the Group interacts with natural capital both directly and indirectly.
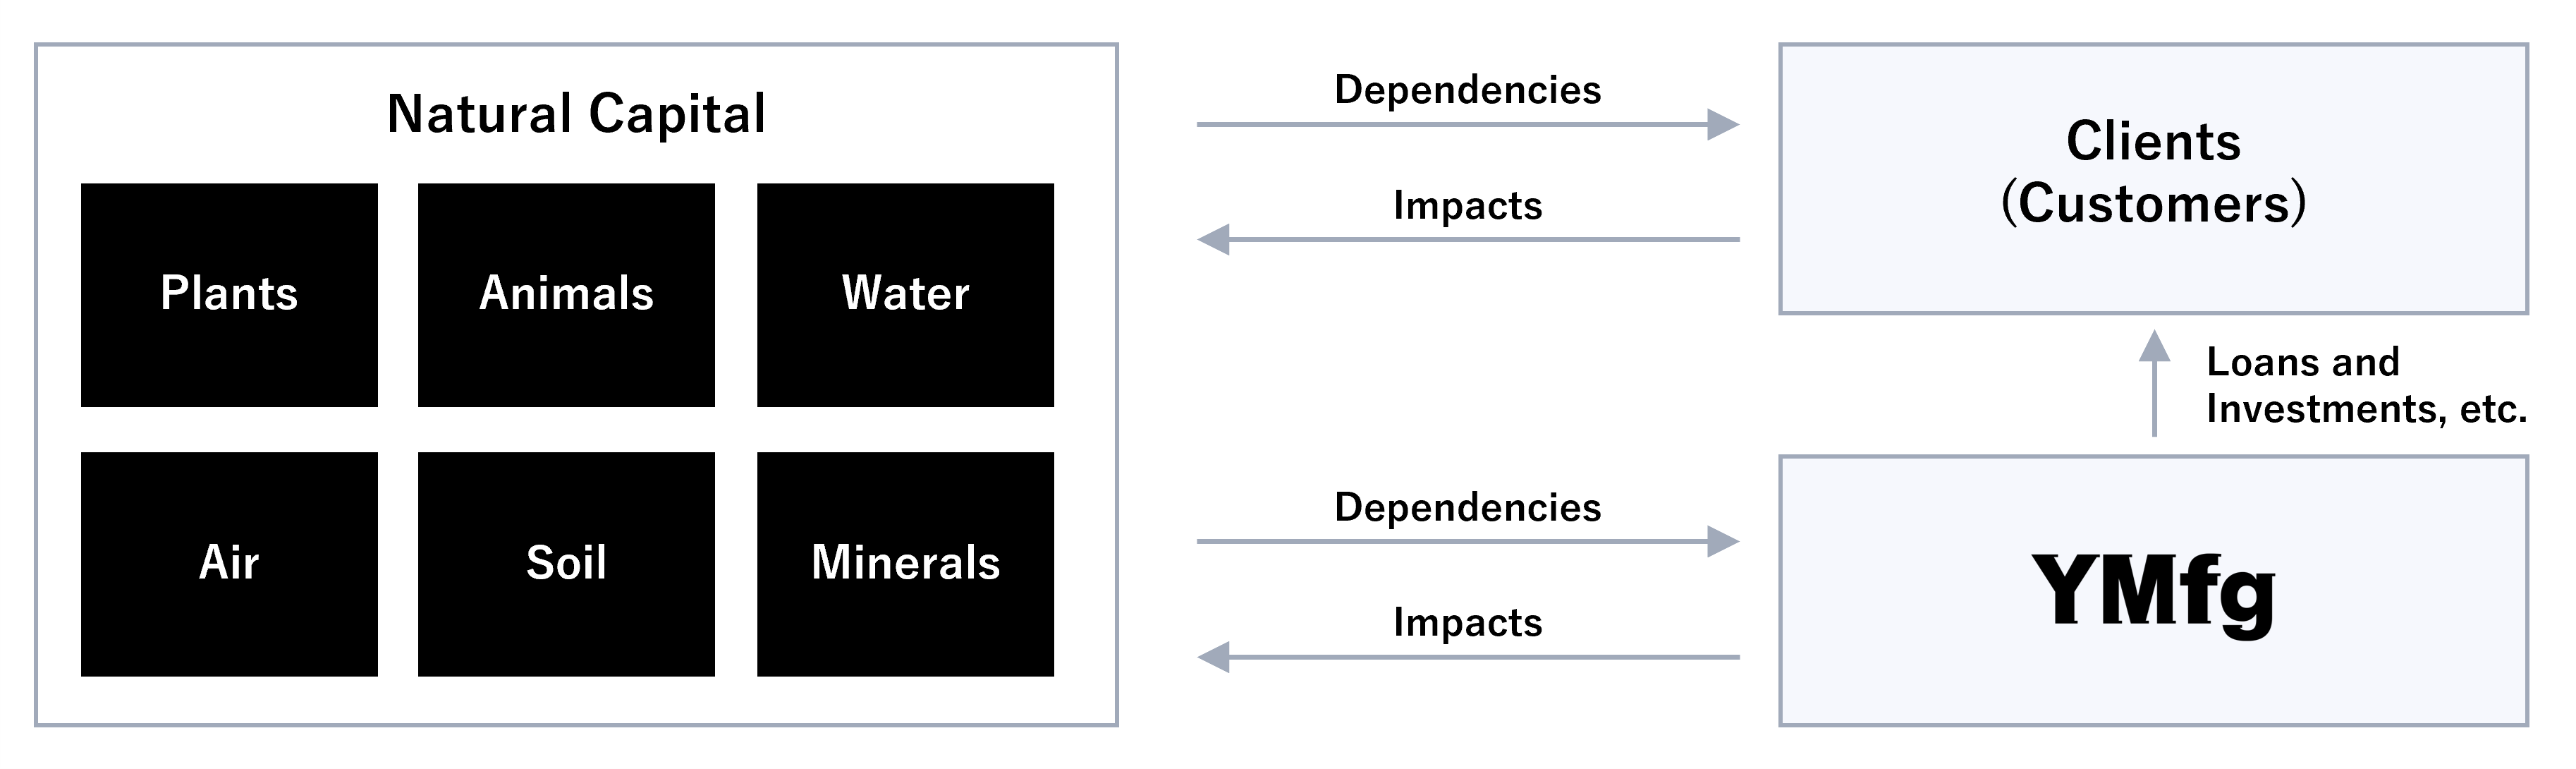
In addition to resource use and environmental impacts associated with our own business activities, dependencies and impacts on natural capital also arise across the value chains of companies we engage with through our lending and investment activities. Based on this understanding, we will continue to identify and analyze these dependencies and impacts while working to reduce risks and create opportunities.
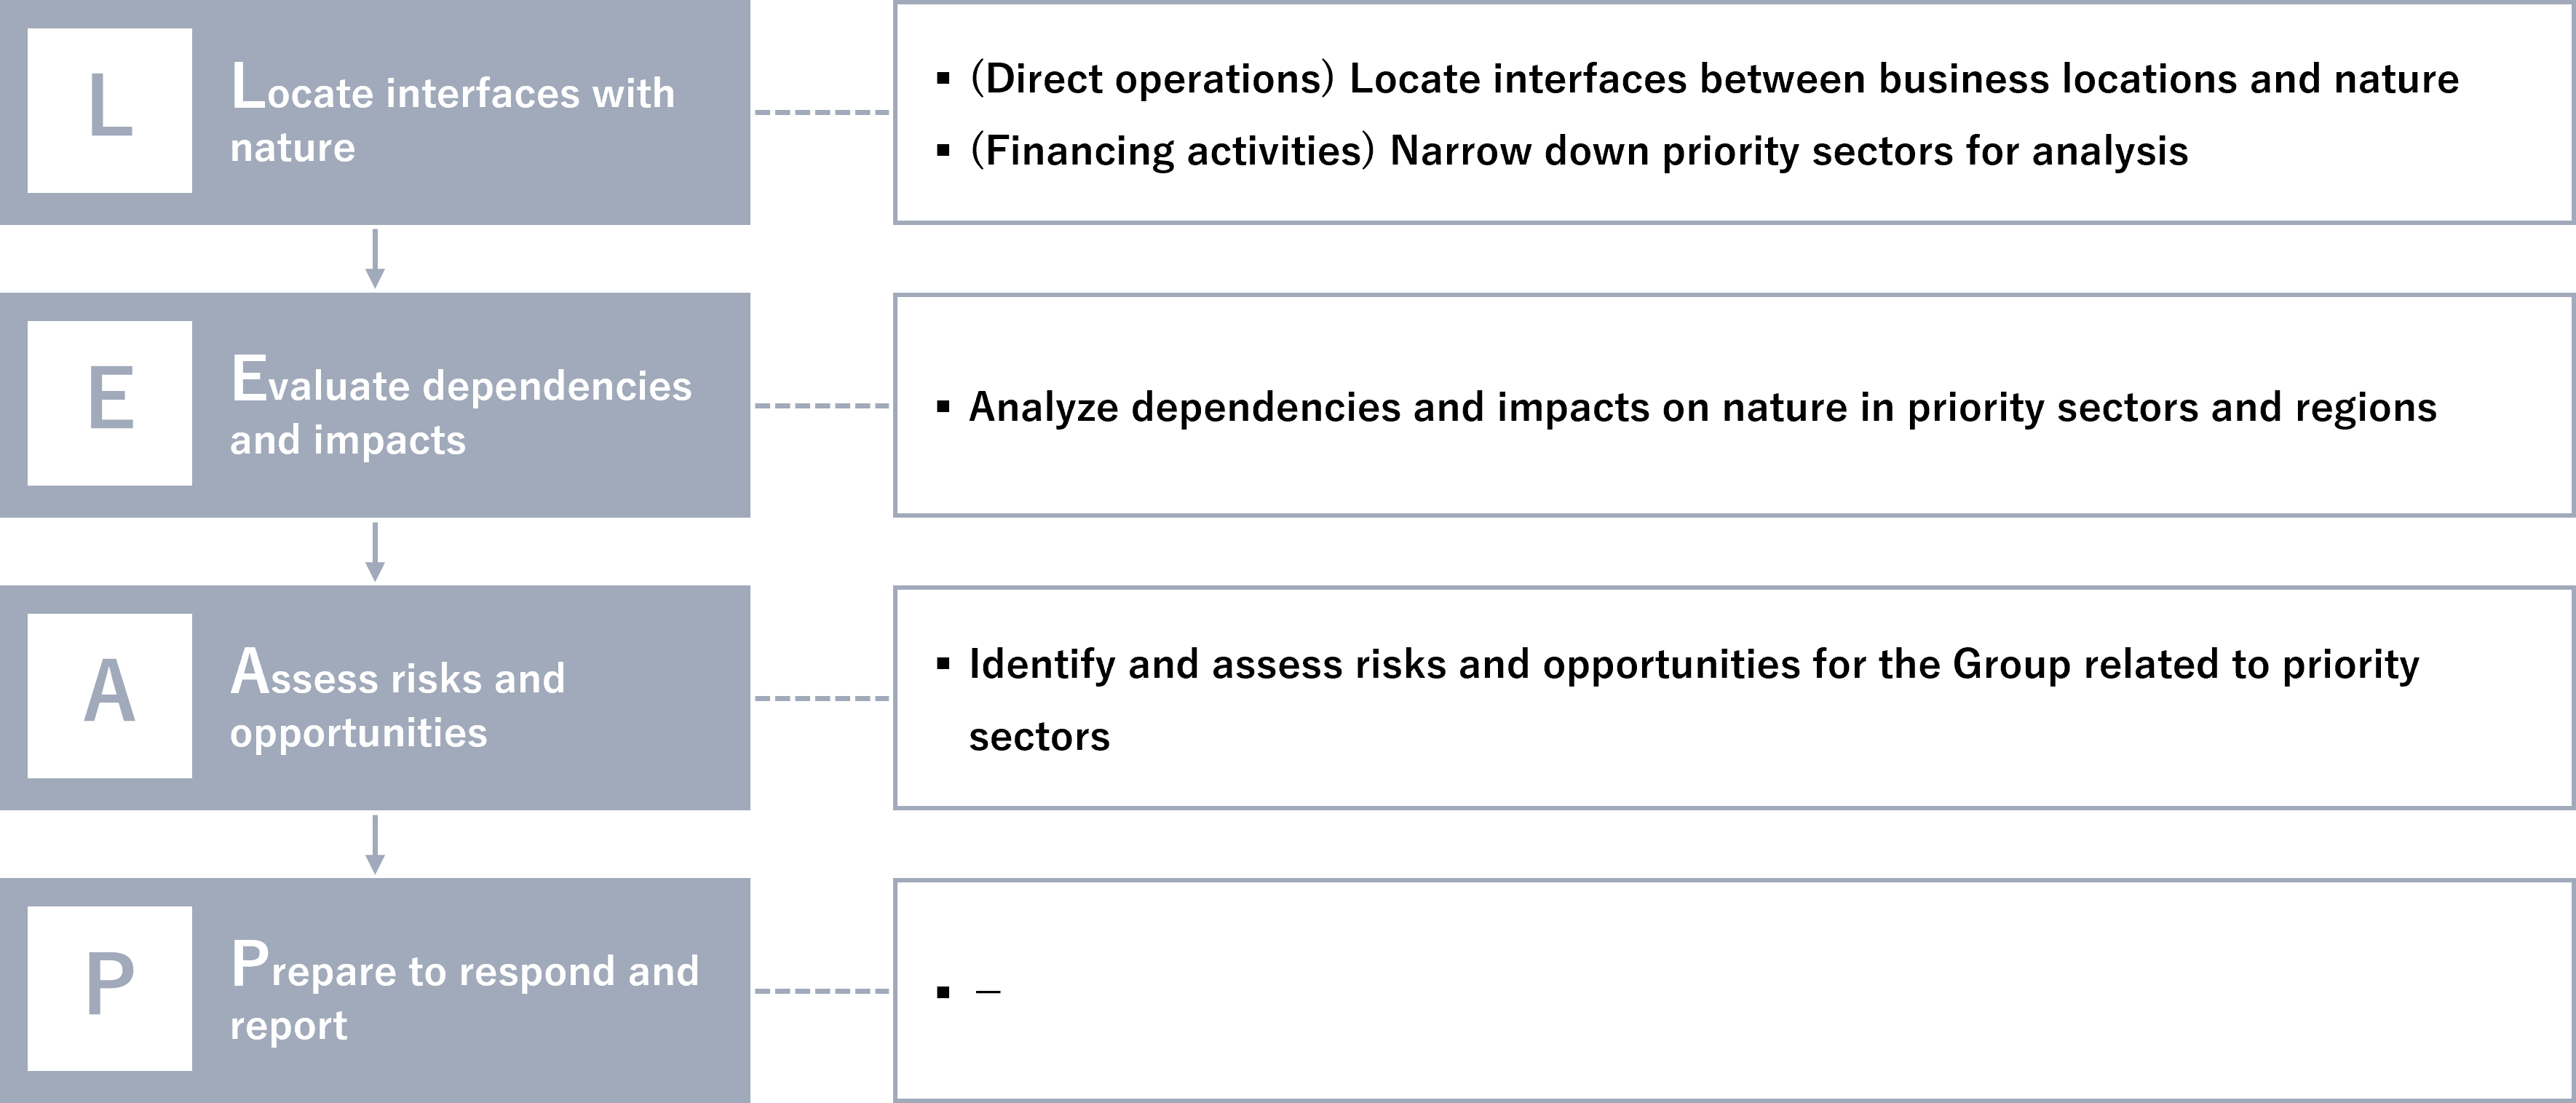
For our analysis, we have adopted the TNFD-recommended LEAP approach* to enable practical responses to natural capital and biodiversity. In FY2025, we organized the relationship between the Group’s business activities and nature, selected priority sectors for analysis, and identified key risks and opportunities.
- LEAP approach: An integrated approach for assessing nature-related issues, consisting of four steps—Locate (locate interfaces with natural capital), Evaluate (evaluate dependencies and impacts), Assess (assess risks and opportunities), and Prepare (prepare and implement responses).
Analytical Activities and the LEAP Approach
The Group reviewed the interfaces between the principal operating locations* of the three Group banks in Yamaguchi, Hiroshima, and Fukuoka Prefectures and sensitive locations under the TNFD framework.
- In this analysis, “principal operating locations” are defined as block branches of the three Group banks that play a core role in their respective regions (53 locations in total).
Based on the TNFD criteria for sensitive locations, we applied the indicators shown in the table below from three perspectives: “Biodiversity Importance,” “Ecosystem Integrity (areas of high integrity or areas experiencing rapid decline),” and “Physical Water Risks.”
|
Category |
Perspective |
Indicator |
Data Source |
|
Biodiversity Importance |
Protected areas |
Protected Areas |
IBAT (WDPA: World Database of Protected Areas) |
|
Areas important for biodiversity |
Key Biodiversity Areas (KBA) |
IBAT |
|
|
Areas hosting rare or endemic species Areas near habitats of threatened species |
Species Threat Abatement and Restoration (STAR-t) |
IBAT |
|
|
Ecosystem Integrity |
Areas with high ecosystem integrity |
Biodiversity Intactness Index (BII) |
Biodiversity Intactness Index |
|
Areas with declining ecosystem integrity |
Tree Cover Loss |
Global Forest Watch |
|
|
Physical Water Risks |
Areas with low water availability |
Baseline Water Stress |
Aqueduct |
|
Areas at risk of water quality deterioration |
Biochemical Oxygen Demand (BOD) |
Water quality data |
|
|
Areas with high flood risk |
Planned flood inundation areas (river flooding) |
MLIT “Hazard Map Overlay” |
By overlaying the locations of each operational site with the distribution of sensitive locations identified based on the indicators described above, we identified the interfaces between our operations and nature.
In addition, as the TNFD framework includes “importance of ecosystem service provision” as one of the criteria for identifying sensitive locations, we also reviewed the interfaces between our operations and areas inhabited by Indigenous Peoples. However, as no data on Indigenous Peoples’ territories was found for the Group’s principal operating regions, these areas were excluded from the scope of the analysis.
The results of the analysis for the Group’s operational sites—defined as the principal operating locations of the three Group banks in the Group’s primary operating regions (53 locations in total)—are presented below.
For each indicator, the results are based on an evaluation derived from external data sources, including IBAT, in which scores were assigned on a 5-point scale (with 5 indicating high and 1 indicating low), reflecting the level of impact on nature and associated risks. The number of locations assessed as high-scoring (a score of 4 or above) is presented.
|
Biodiversity Importance |
|||
|
Protected Areas |
Key Biodiversity Areas (KBA) |
Species Threat Abatement and Restoration (STAR‑t) |
|
|
Yamaguchi Prefecture (Scope: 24 locations) |
1 location |
4 locations |
0 locations |
|
Hiroshima Prefecture (Scope: 23 locations) |
0 locations |
0 locations |
0 locations |
|
Fukuoka Prefecture (Scope: 6 locations) |
0 locations |
0 locations |
0 locations |
|
Ecosystem Integrity |
||
|
Biodiversity Intactness Index (BII) |
Tree Cover Loss |
|
|
Yamaguchi Prefecture (Scope: 24 locations) |
3 locations |
0 locations |
|
Hiroshima Prefecture (Scope: 23 locations) |
0 locations |
0 locations |
|
Fukuoka Prefecture (Scope: 6 locations) |
0 locations |
0 locations |
|
Physical Water Risks |
|||
|
Baseline Water Stress |
Biochemical Oxygen Demand (BOD) |
Planned flood inundation areas (river flooding) |
|
|
Yamaguchi Prefecture (Scope: 24 locations) |
0 locations |
24 locations |
2 locations |
|
Hiroshima Prefecture (Scope: 23 locations) |
0 locations |
23 locations |
3 locations |
|
Fukuoka Prefecture (Scope: 6 locations) |
0 locations |
6 locations |
0 locations |
- “Biodiversity Importance”: 5 locations were assessed as high-scoring, confirming that some sites are located in proximity to important natural environments such as protected areas and KBAs.
- “Ecosystem Integrity”: 3 locations were assessed as high-scoring, confirming that some sites are located in proximity to areas with high ecological integrity.
- “Physical Water Risks”: All locations were assessed as high-scoring, indicating that water quality risks are relatively high across all sites.
Through this analysis, we confirmed that some operational sites have relatively significant interfaces with nature. However, as these sites are primarily used as offices, their direct impacts on nature are assessed to be limited.
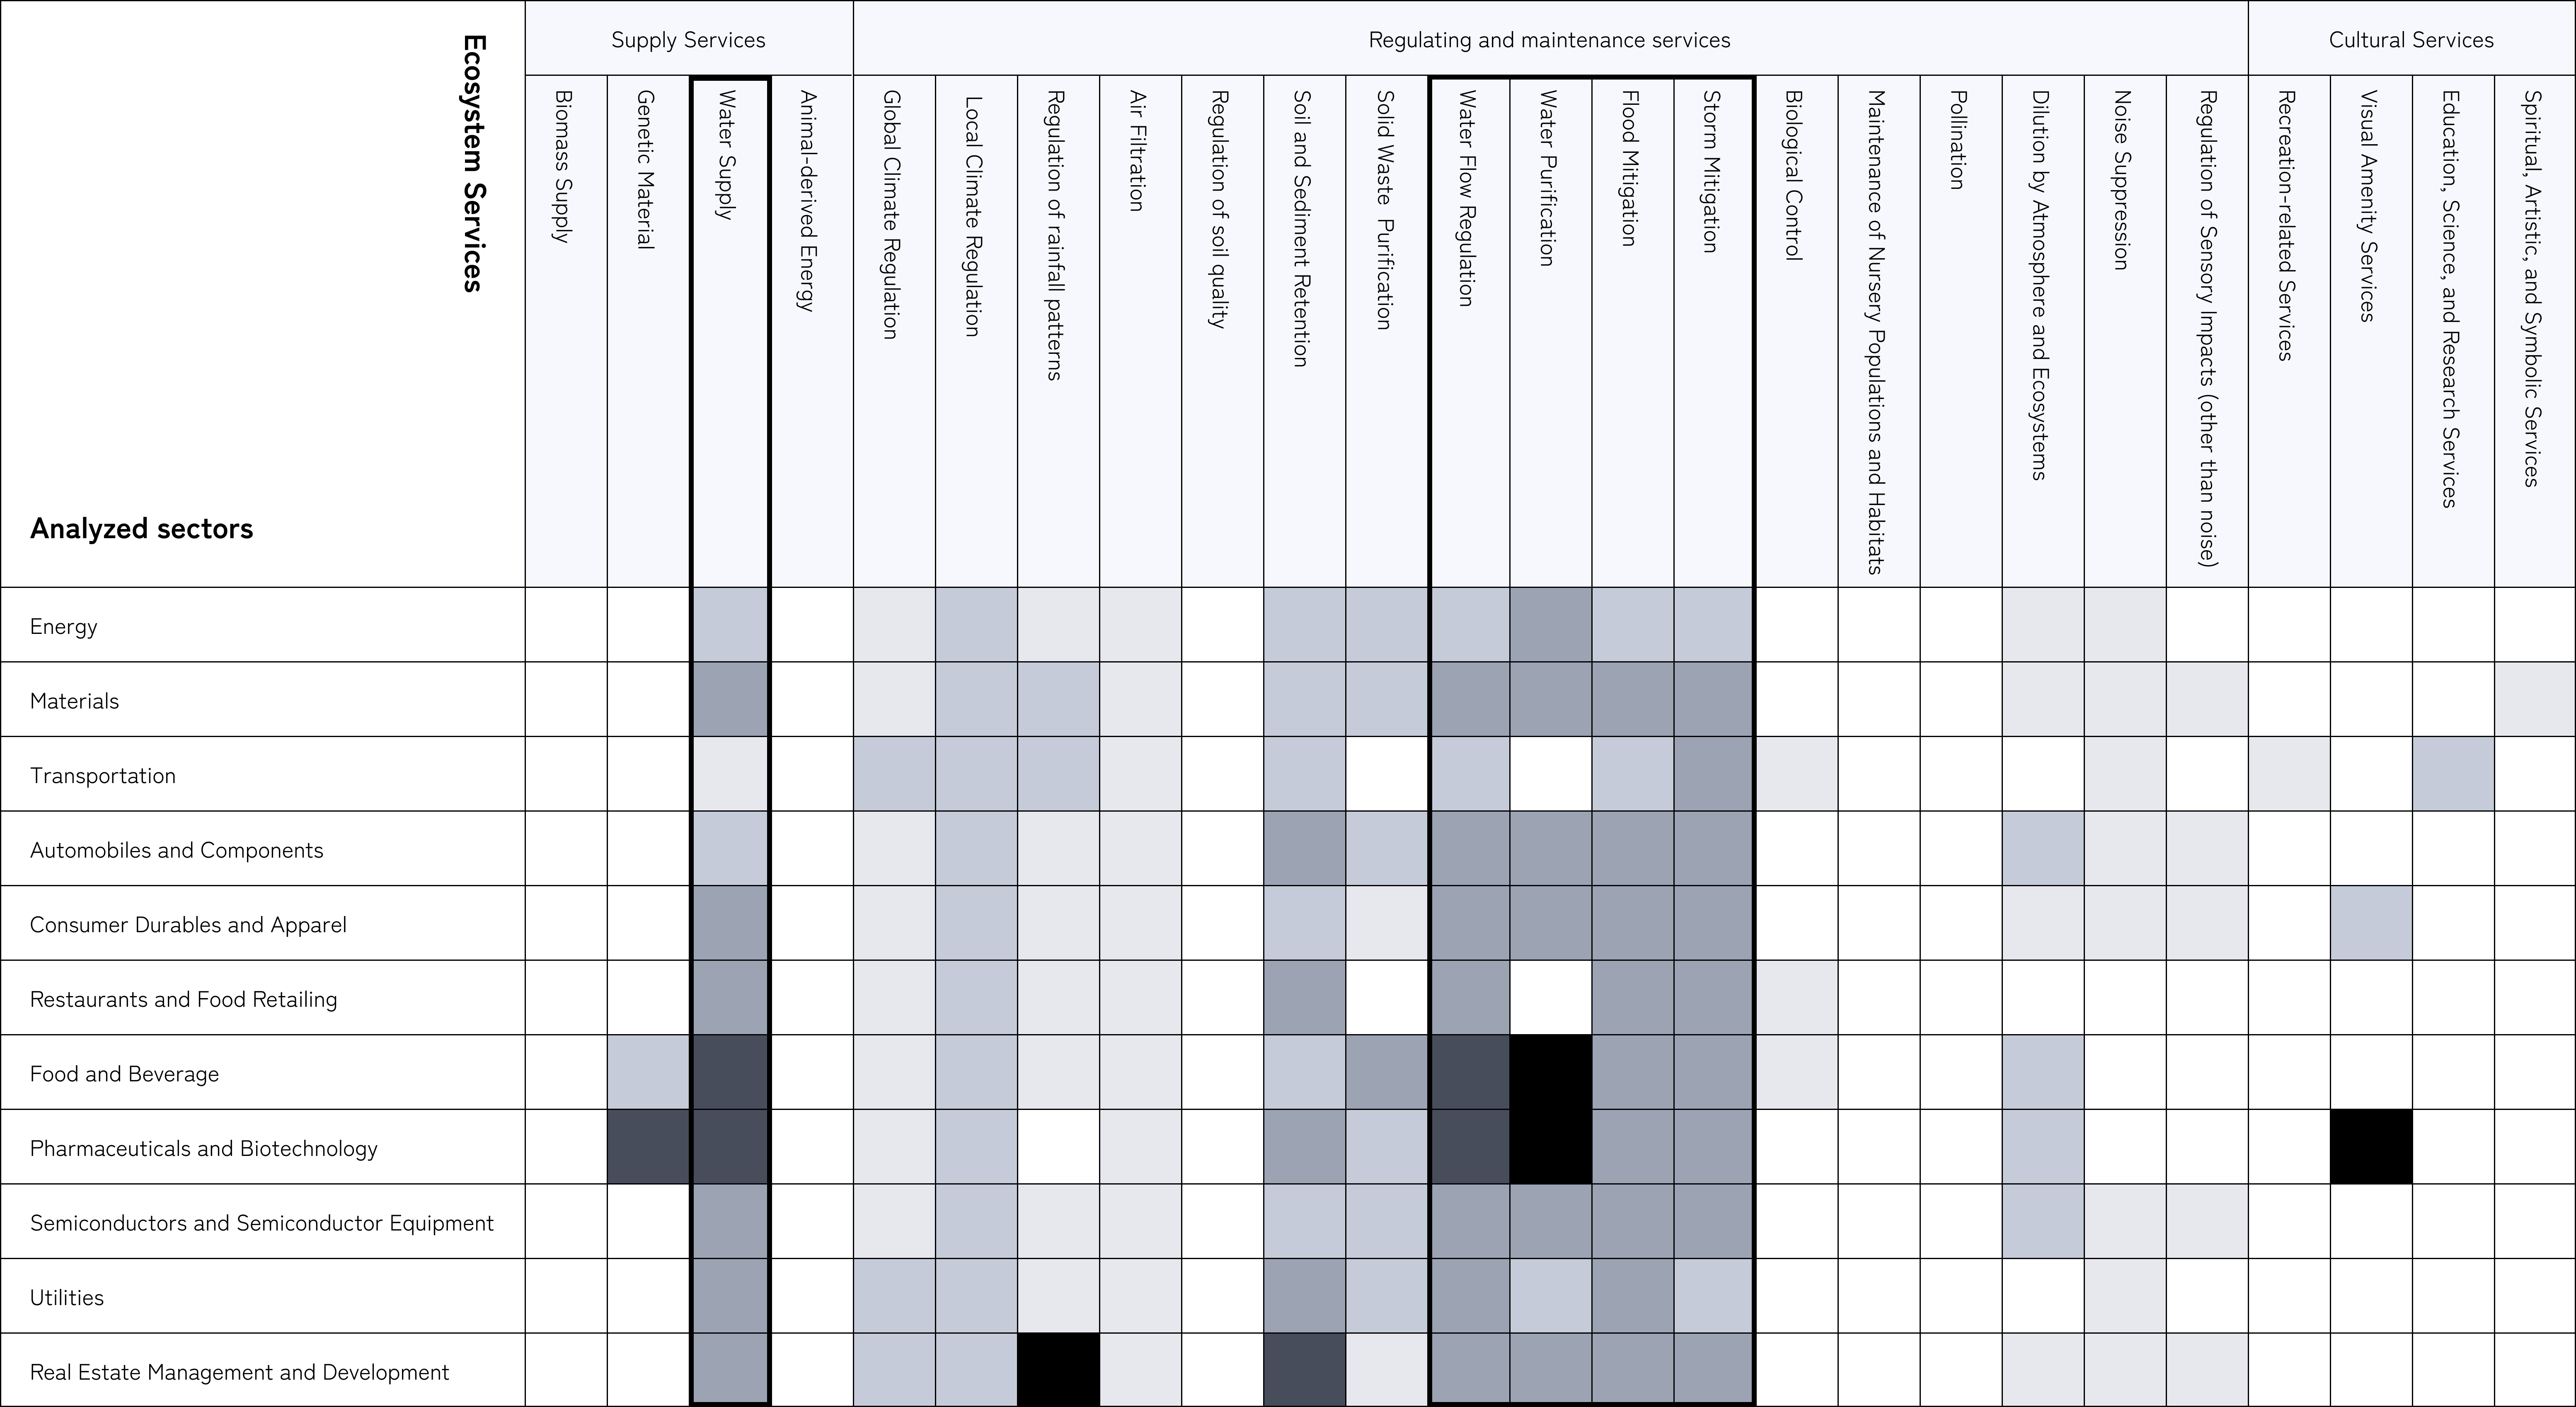
To understand the interfaces between nature and the Group’s lending portfolio, we use ENCORE—a global tool that maps nature-related dependencies and impacts associated with business activities—to analyze nature-related relationships at the sector level.
Through this analysis, we identified cross-sector trends within the Group’s lending portfolio. In terms of dependencies, there is a significant reliance on water-related ecosystem services. In terms of impacts, we confirmed that emissions of hazardous pollutants to water and soil, as well as disturbances (e.g., noise and light), are among the most significant.
Dependencies on Nature


Dependencies on Nature

Impacts on Nature
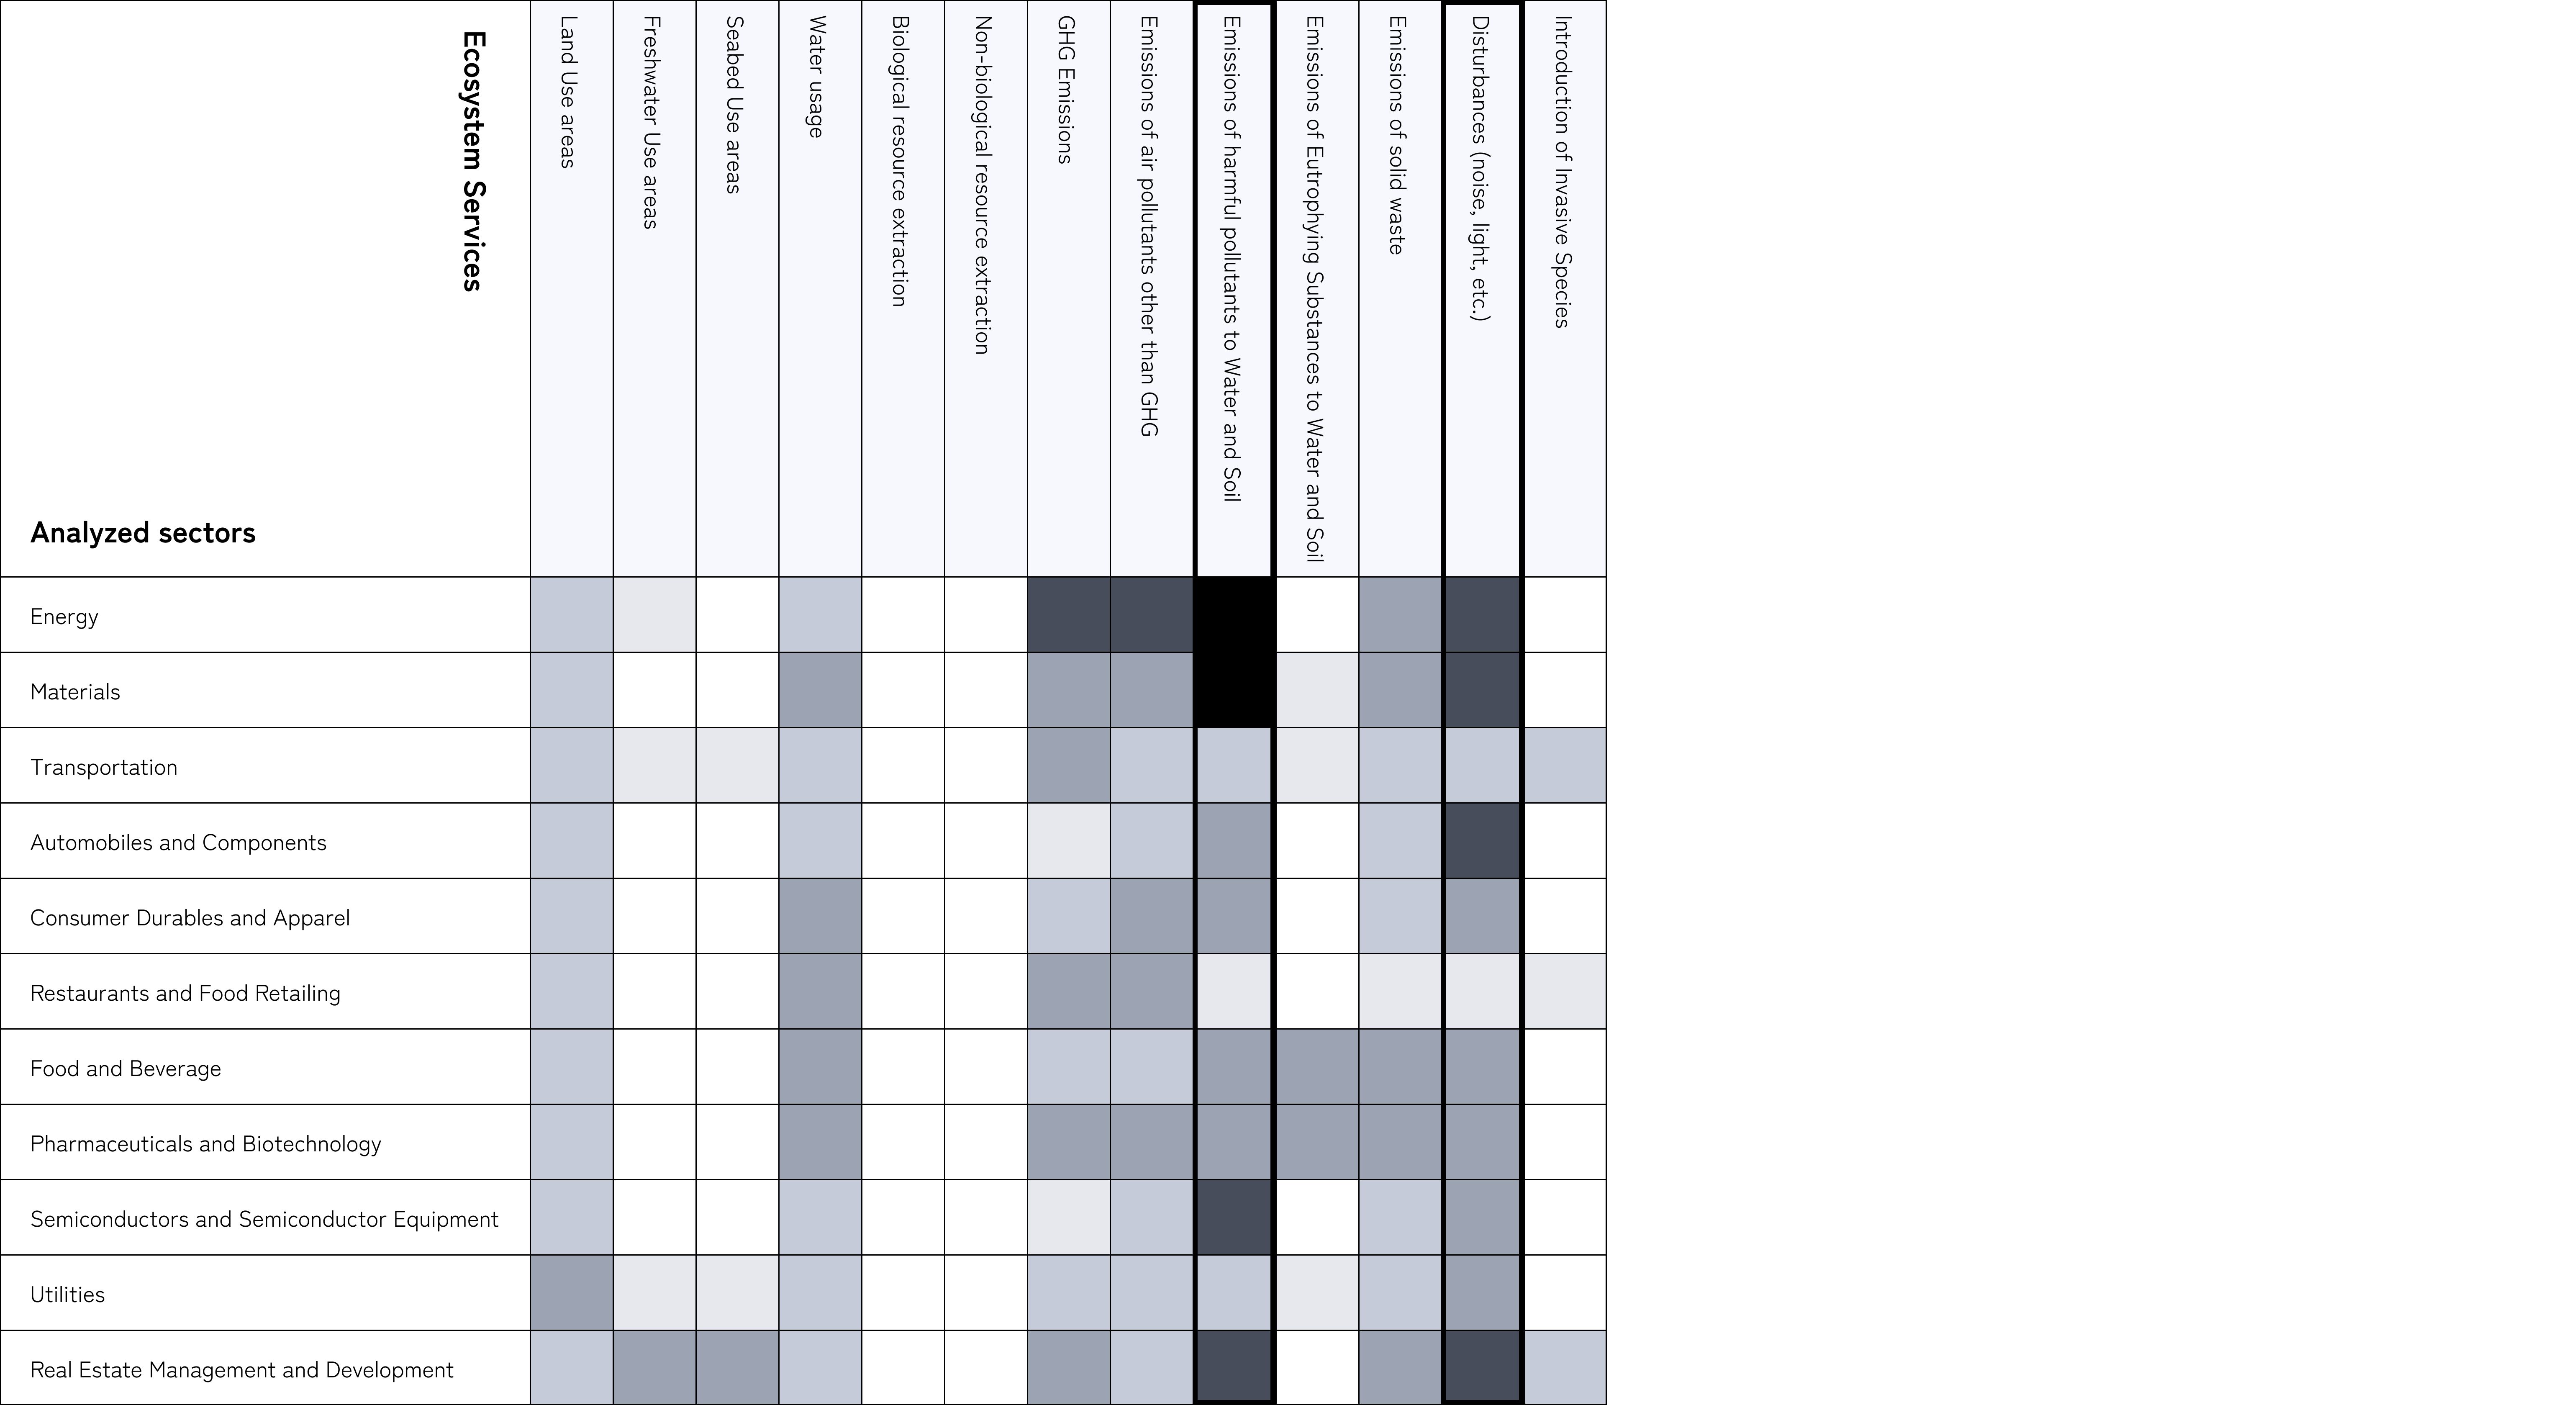
- The shading in the heat map reflects not only the level of dependencies and impacts but also the relative size of outstanding loan balances.
- Sector classifications are based on the sector list provided in the TNFD’s “Additional Guidance for Financial Institutions.”
- “Household and Personal Products” has been excluded from this table, as there were no outstanding loan balances in this sector at the time of the analysis.
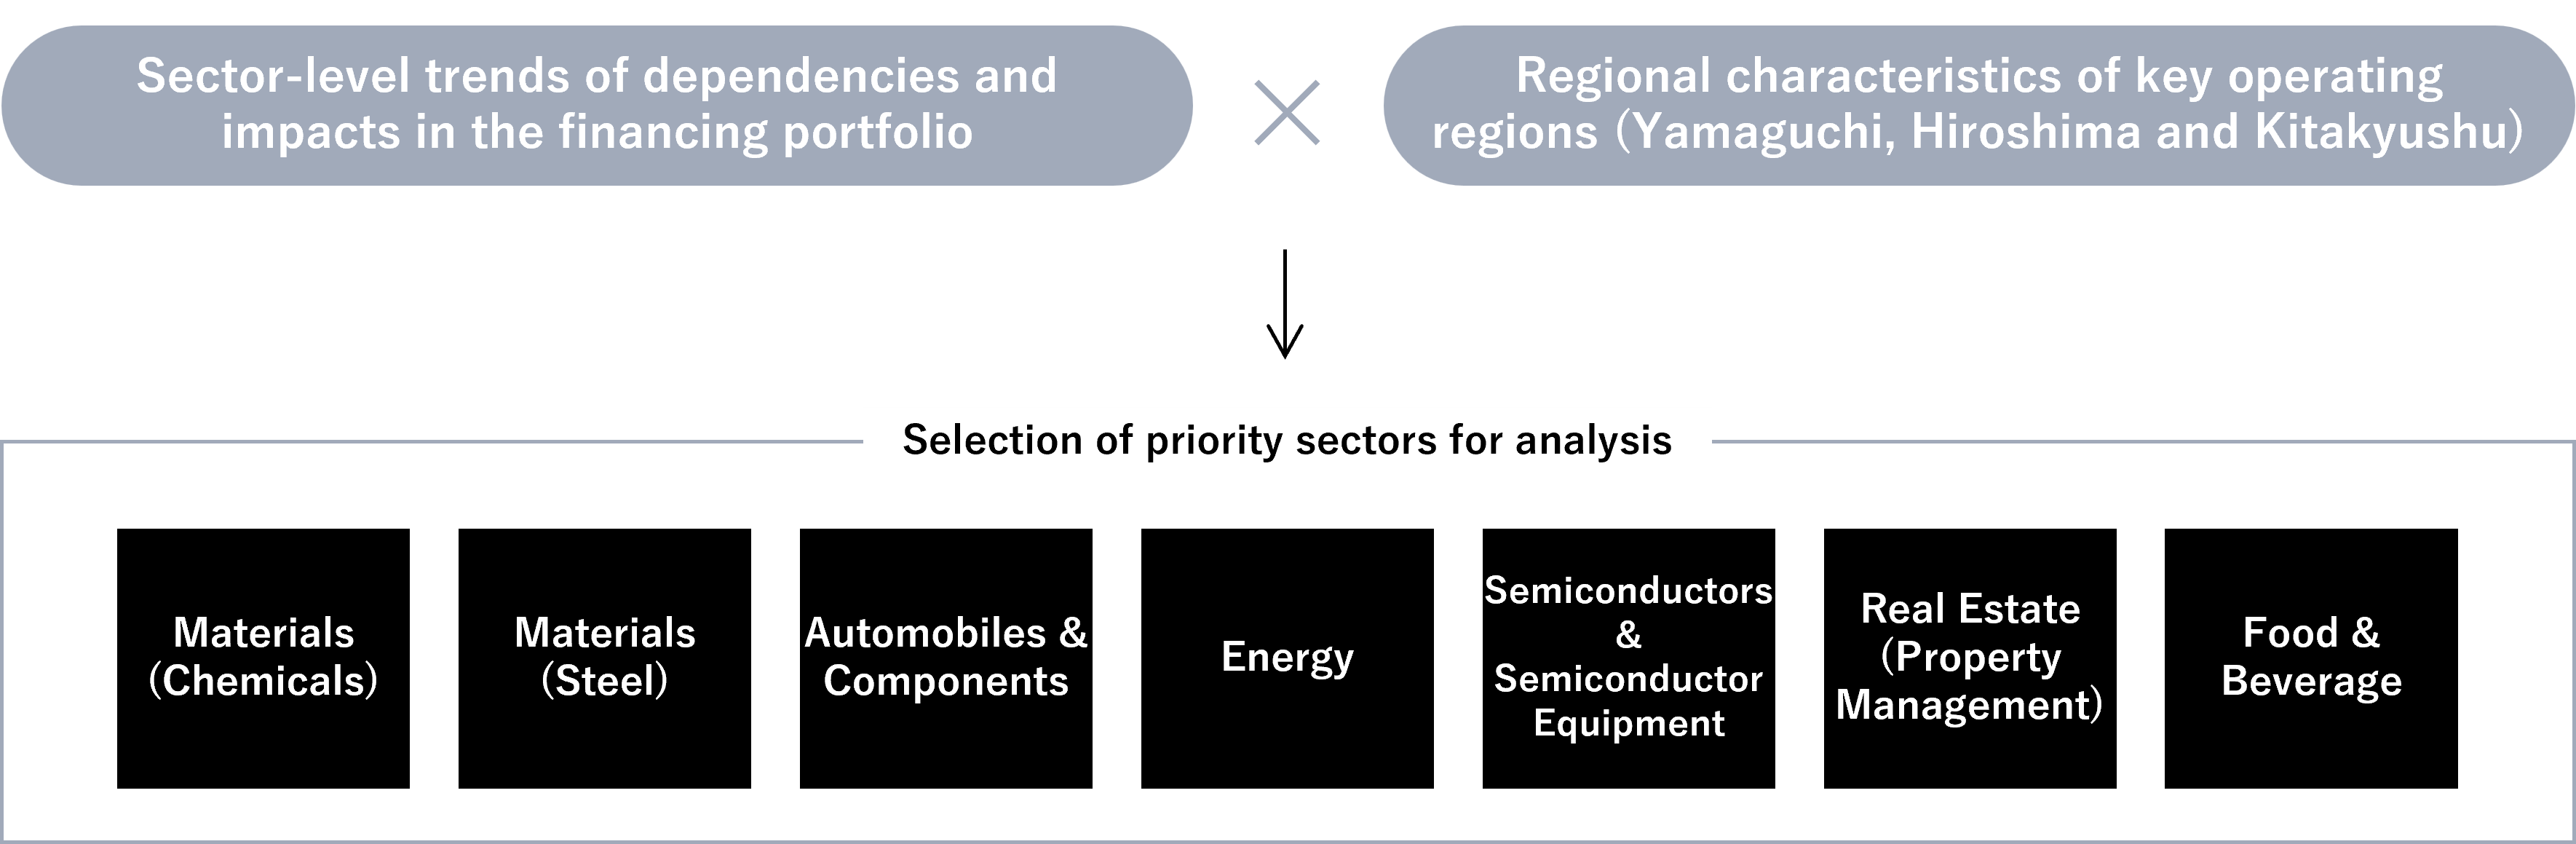
We selected priority sectors for analysis to identify nature-related risks and opportunities. In selecting these sectors, we considered not only the level of sector-level dependencies and impacts on nature—reflected in the distribution of “Very High” and “High” in the heat map—but also the natural and industrial characteristics of the Group’s principal operating regions.
Based on this comprehensive assessment, we selected the following priority sectors for analysis: Materials (Chemicals), Materials (Steel), Automobiles & Components, Energy, Semiconductors & Semiconductor Equipment, Real Estate (Property Management), and Food & Beverage.
Regional Characteristics of Key Areas
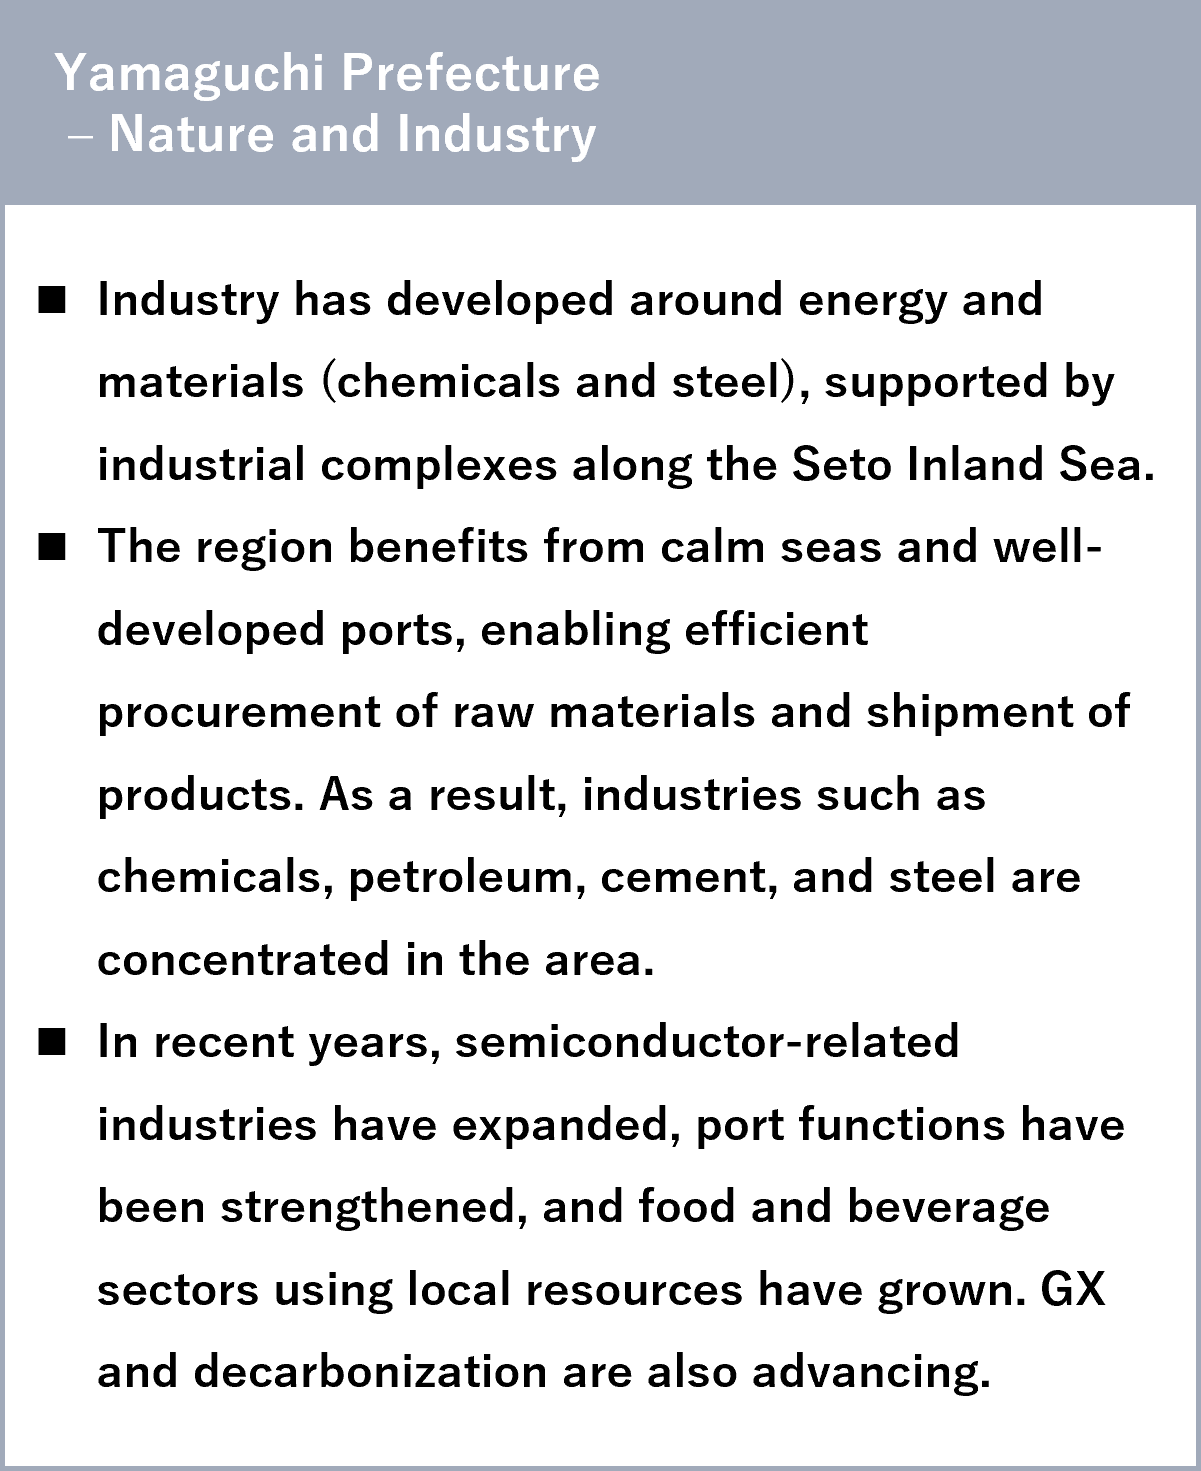
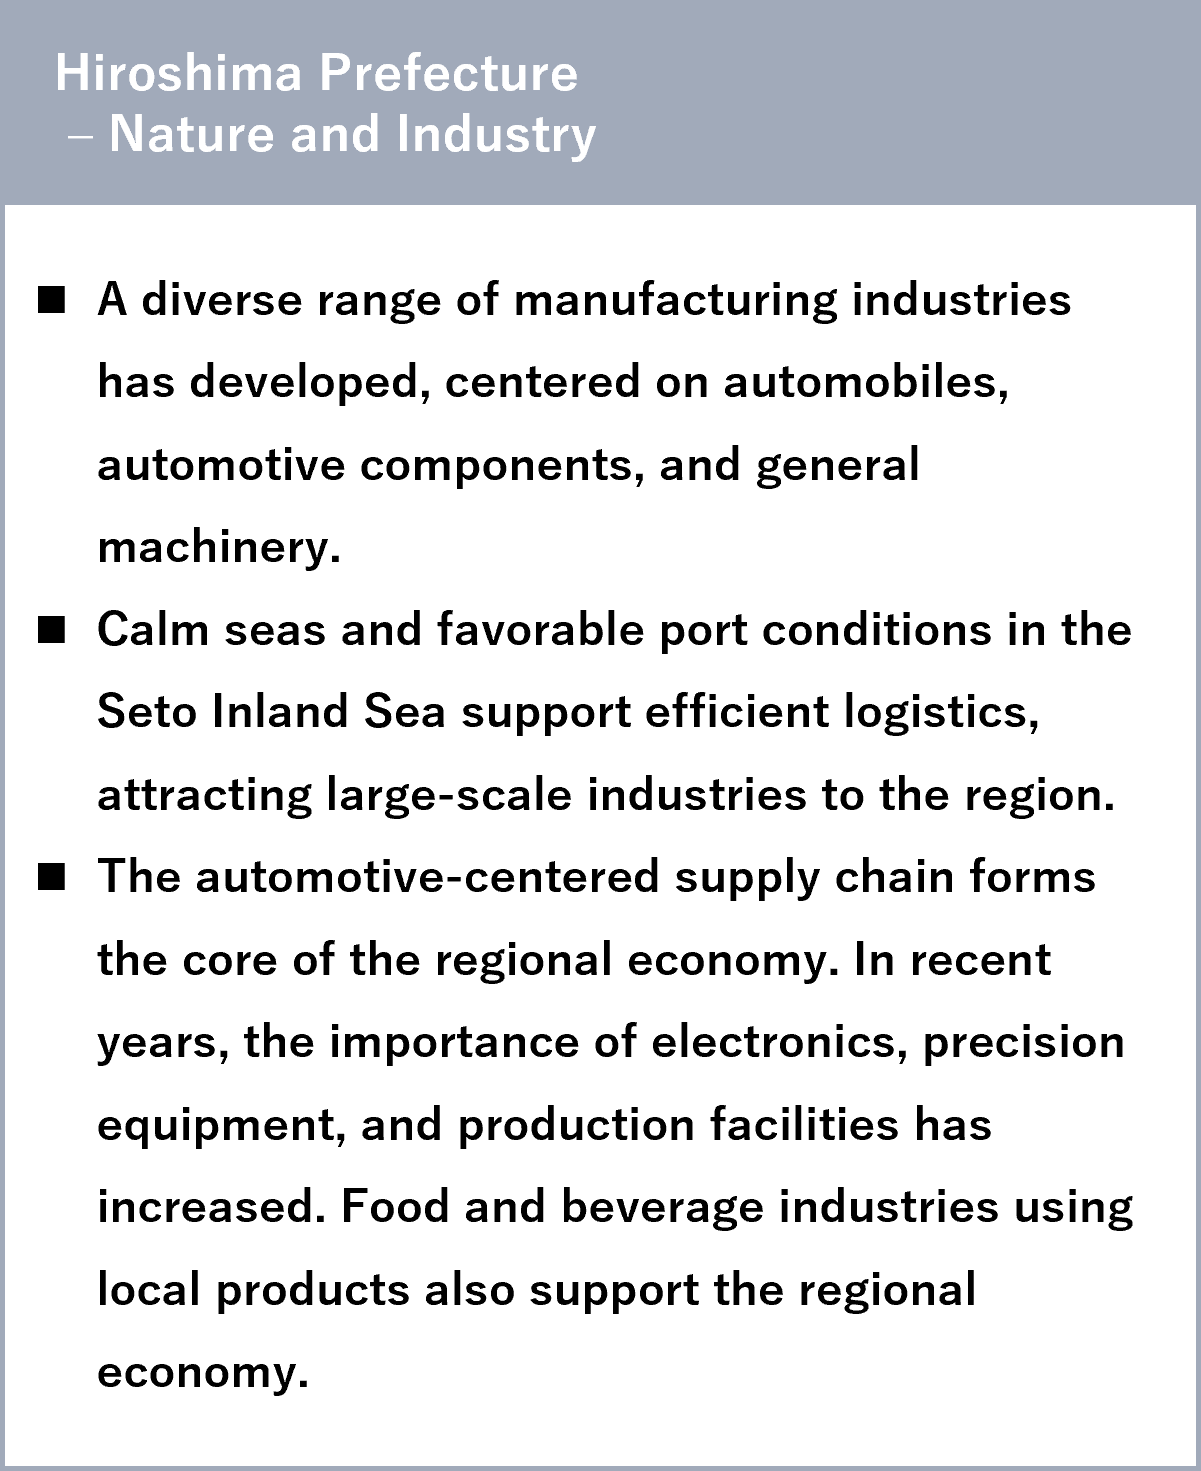
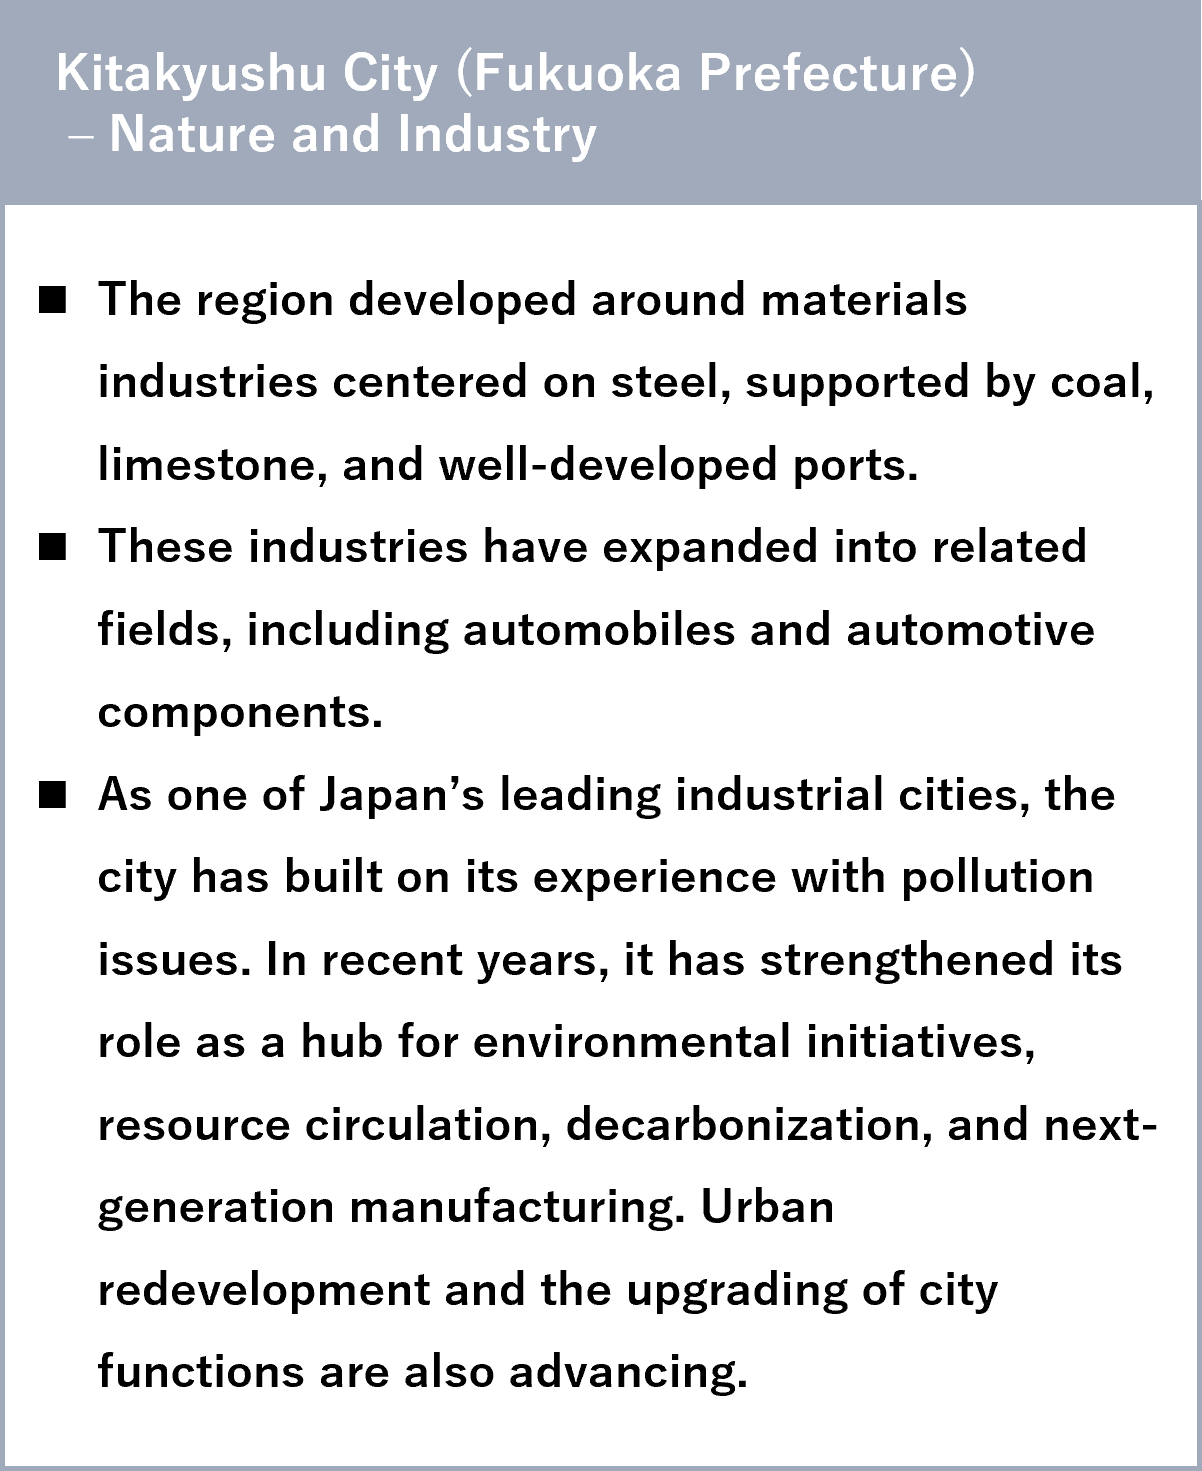
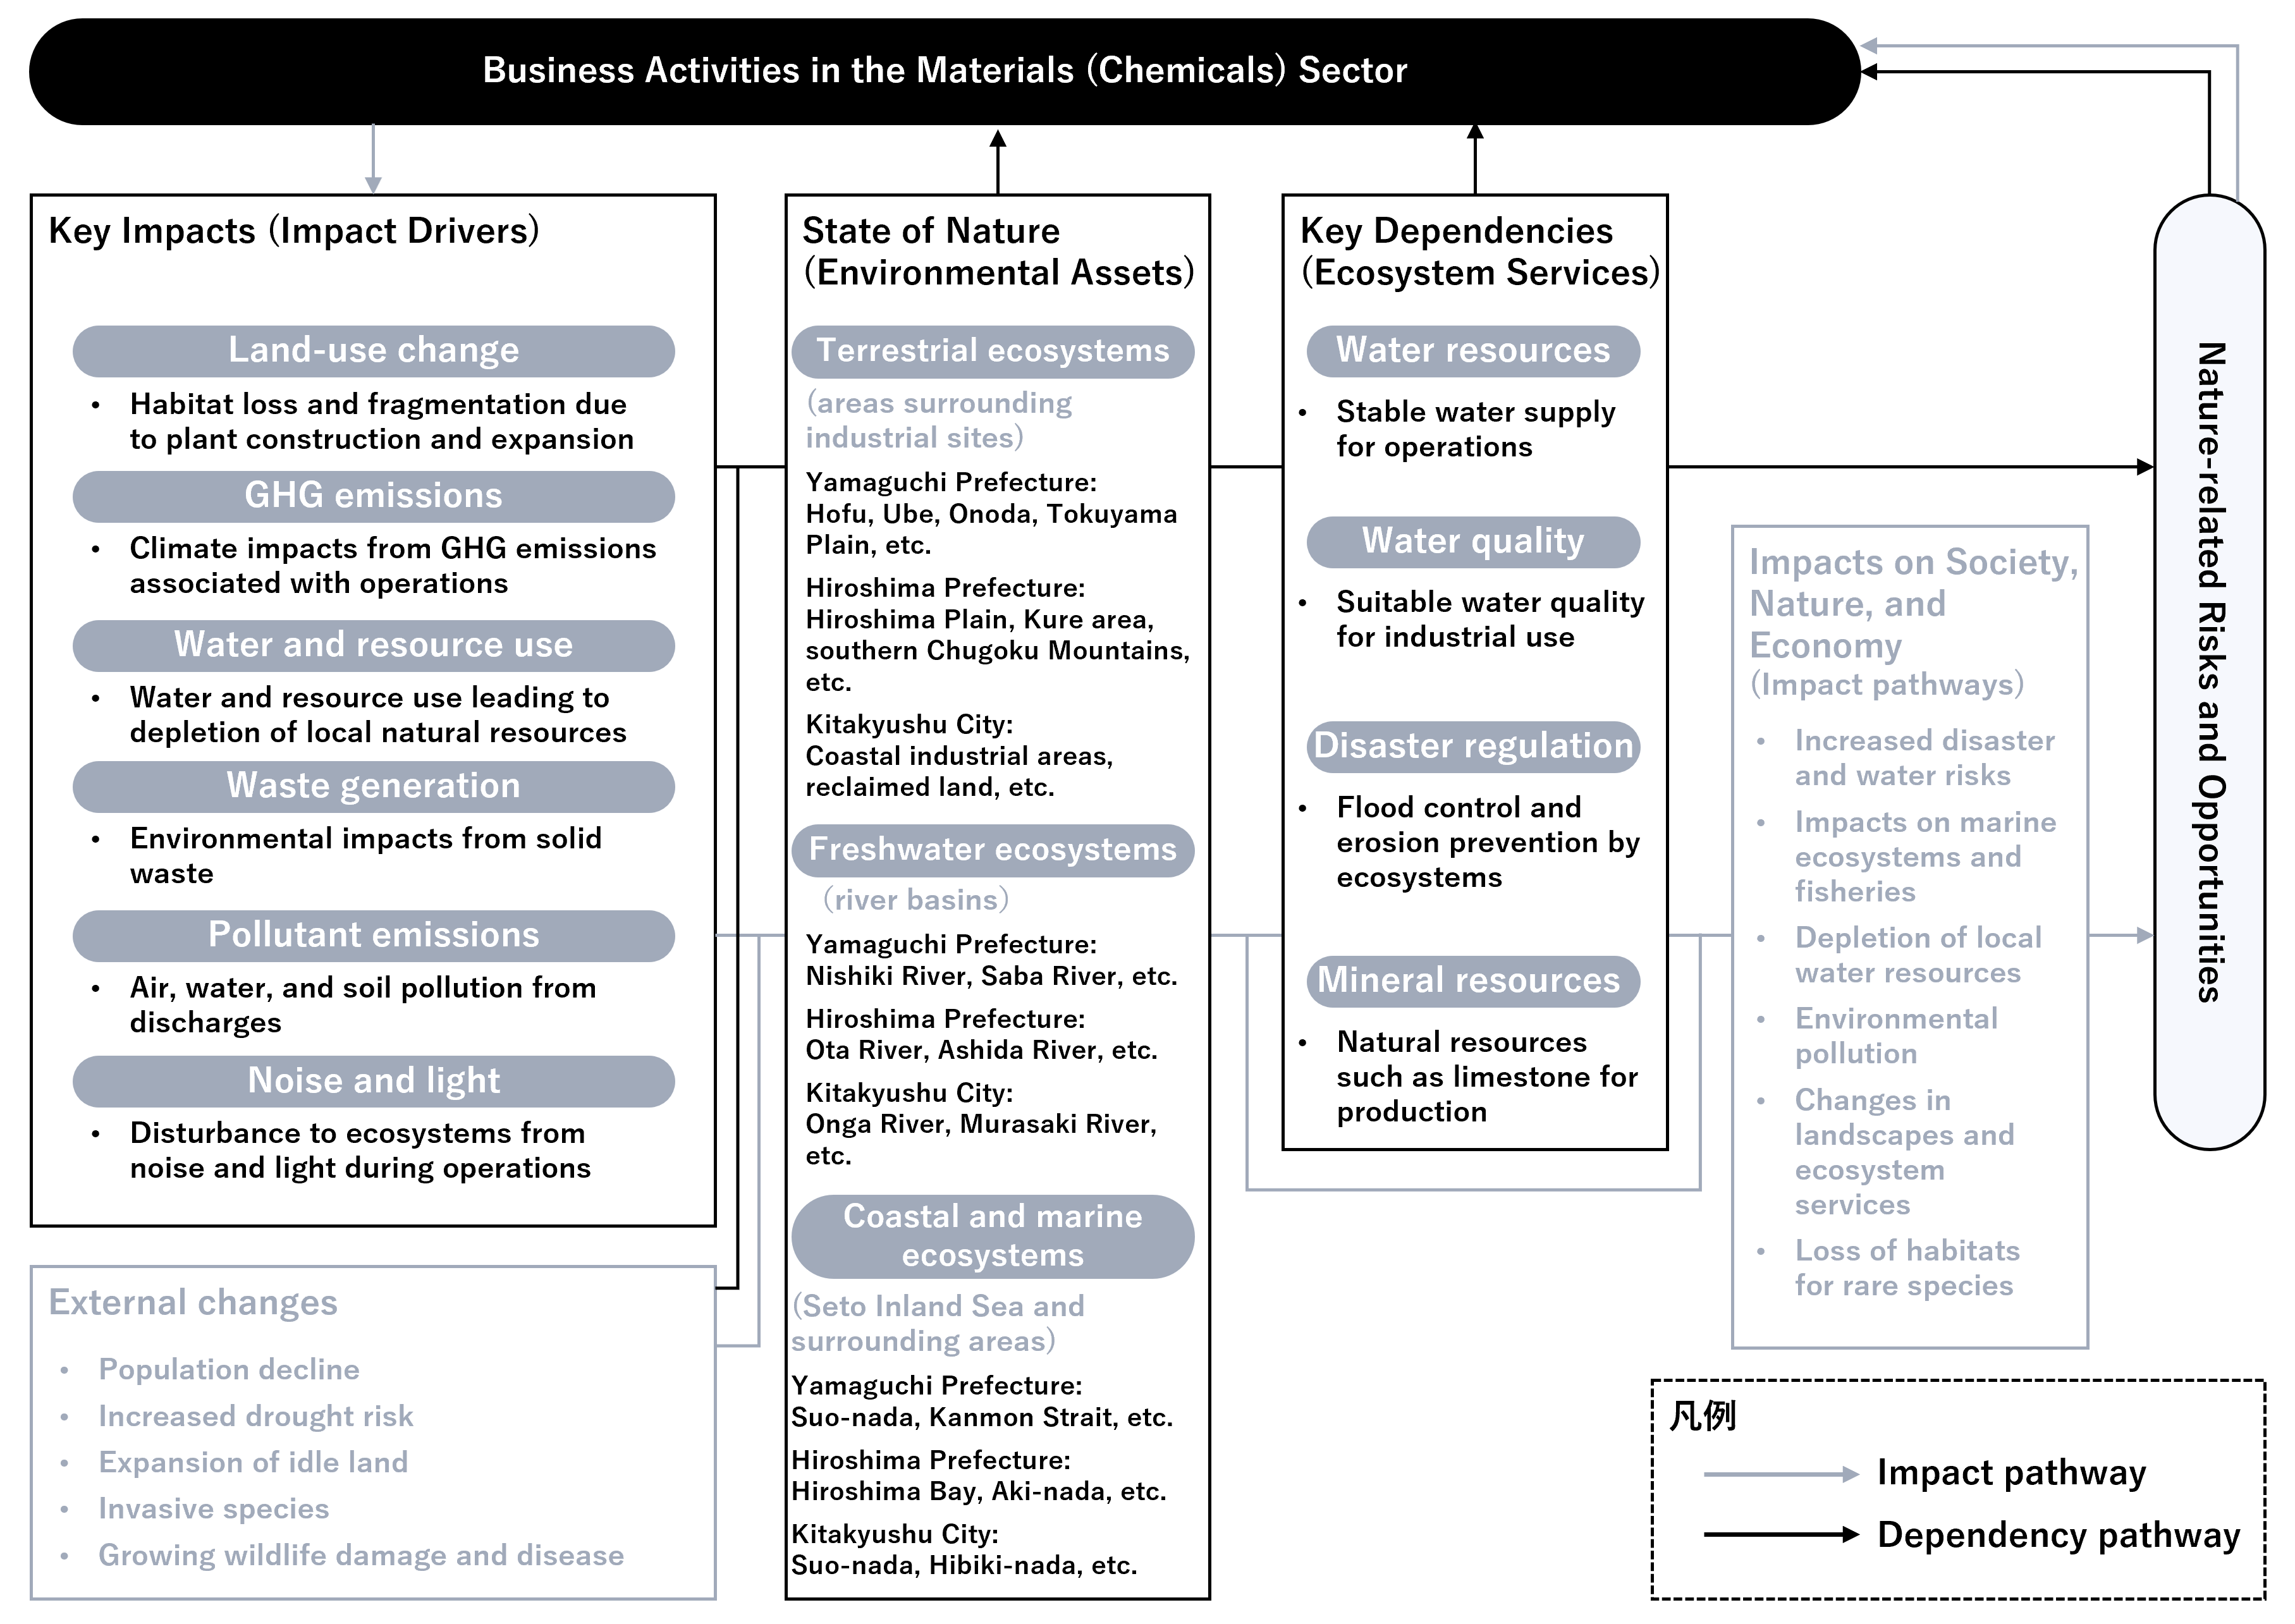
To understand the relationship between nature and the selected priority sectors in Yamaguchi, Hiroshima, and Kitakyushu City, Fukuoka Prefecture, we conducted research on major companies in each sector and reviewed relevant literature on industry and regional characteristics. Based on this analysis, we organized dependencies and impacts on nature in the target regions into pathway diagrams.
Example: Dependency and Impact Pathways in the Materials (Chemicals) Sector
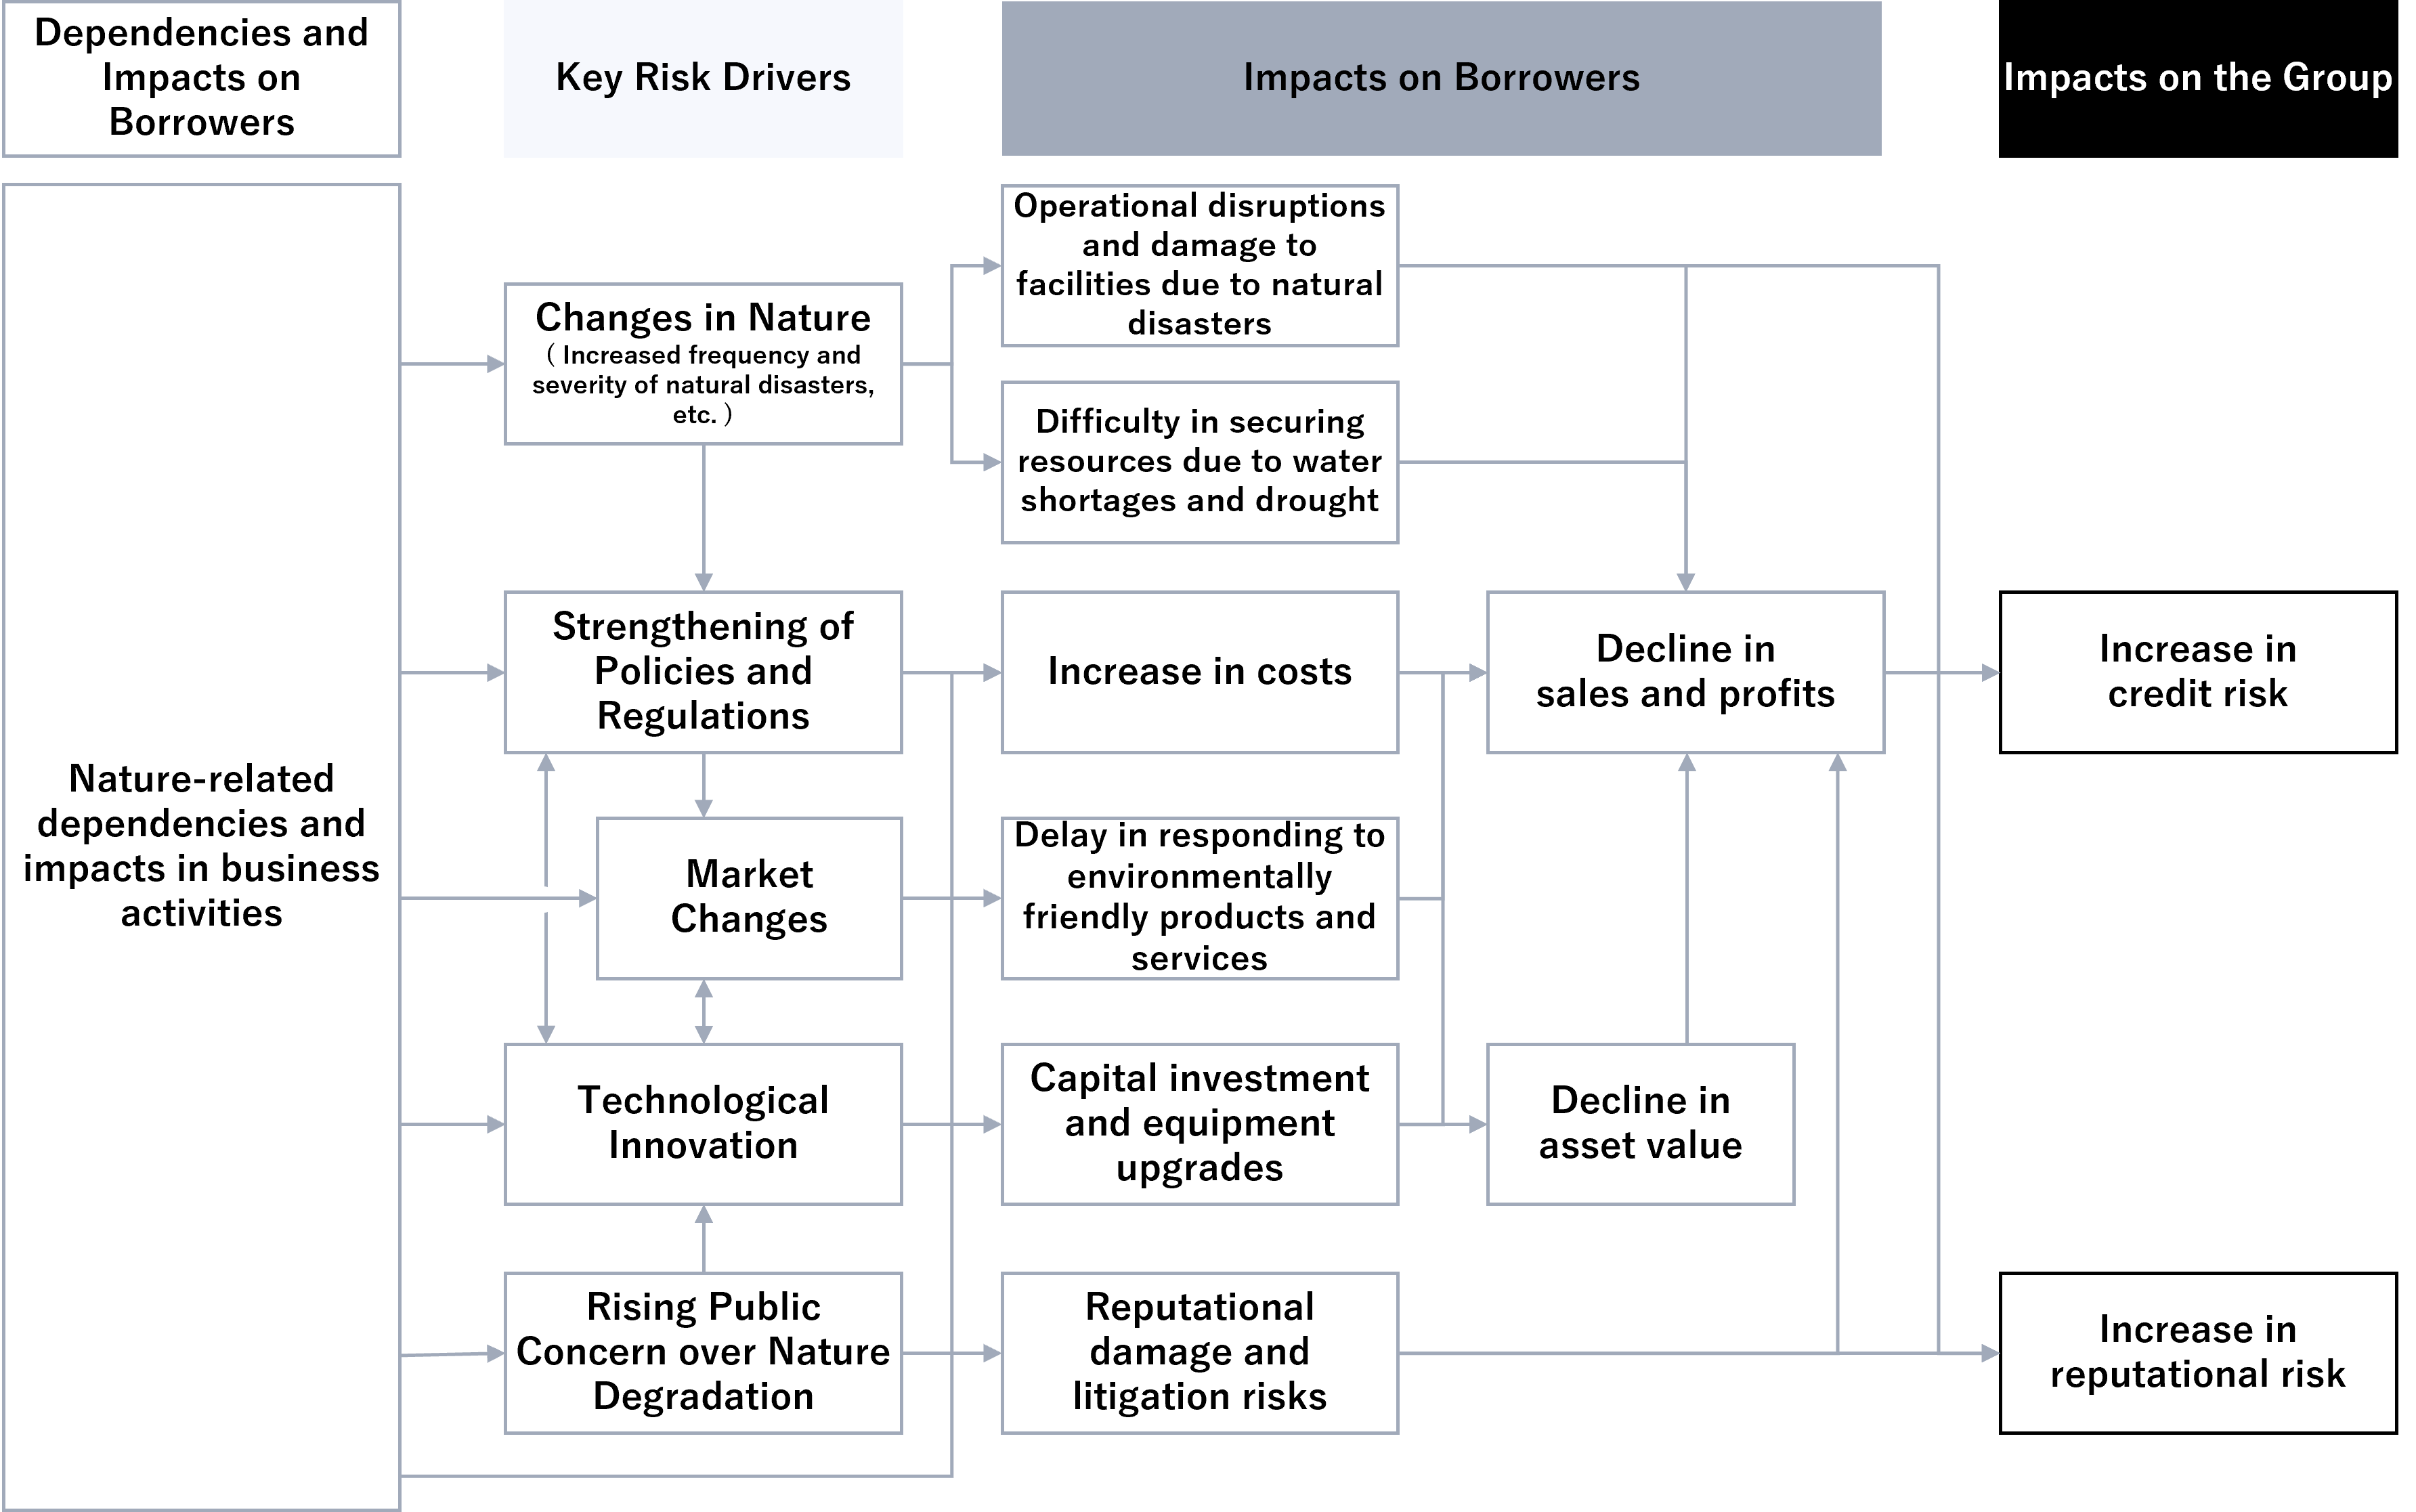
Based on our analysis of dependencies and impacts across the seven selected sectors, we identified the Group’s potential nature-related risks and opportunities with reference to TNFD sector guidance and other relevant frameworks. In doing so, we considered regional and industry characteristics, as well as the time horizon and frequency of occurrence, to identify key risks and opportunities.
Going forward, based on the risks and opportunities identified, we will take appropriate action—including providing financial products and services and engaging with clients—while pursuing value creation that supports the sustainability of both regional businesses and nature.
Overview of Key Risks
Details of Key Risks
|
Risk Type |
Category |
Key Dependencies (★) / Key Impacts (☆) |
Key Risks Derived from Dependencies and Impacts |
Likelihood |
|
|
Frequency*1 |
Time Horizon*2 |
||||
|
Physical Risk |
Acute / Chronic |
★ Water supply, flow regulation ☆ Land use, resource use |
Reduced water availability and drought caused by development and climate change, leading to difficulties in securing water for operations |
Medium |
Medium term |
|
Physical Risk |
Chronic |
★ Flood and storm regulation, sediment retention |
Degradation of ecosystem functions increases exposure to natural disasters (floods, storms, landslides), impacting operations |
Medium |
Long term |
|
Physical Risk |
Chronic |
★ Flood and storm regulation |
Higher insurance costs associated with natural disasters due to weakened ecosystem protection |
Medium |
Medium term |
|
Transition Risk |
Policy |
☆ Pollution |
Stricter regulations on pollutant emissions increase compliance and recycling-related costs |
High |
Medium term |
|
Transition Risk |
Policy |
☆ Resource use |
Strengthened regulations on water use and wastewater quality increase costs for efficiency improvements and facility upgrades |
Medium |
Medium term |
|
Transition Risk |
Policy |
☆ Climate change |
Increased costs associated with tighter GHG emission reduction targets |
Medium |
Medium term |
|
Transition Risk |
Market |
☆ Resource use |
Failure to respond to rising demand for environmentally friendly products leads to lost business opportunities and reduced revenue |
Medium |
Medium term |
|
Transition Risk |
Reputation |
☆ Pollution |
Reputational damage from environmental pollution (air, water, soil) leads to revenue loss and business impact |
Medium |
Short term |
|
Transition Risk |
Reputation |
☆ Land use, climate change, pollution |
Negative perception of environmental impacts results in loss of policy support and reduced investment |
Medium |
Medium term |
|
Transition Risk |
Liability |
☆ Resource use, pollution |
Inadequate management of resources and pollutants leads to litigation and liability costs if environmental damage occurs |
High |
Medium term |
- High: Likely to occur on an annual basis or more frequently; Medium: Likely to occur once every few years
- Short-term: less than 3 years; Medium-term: 3–10 years; Long-term: more than 10 years
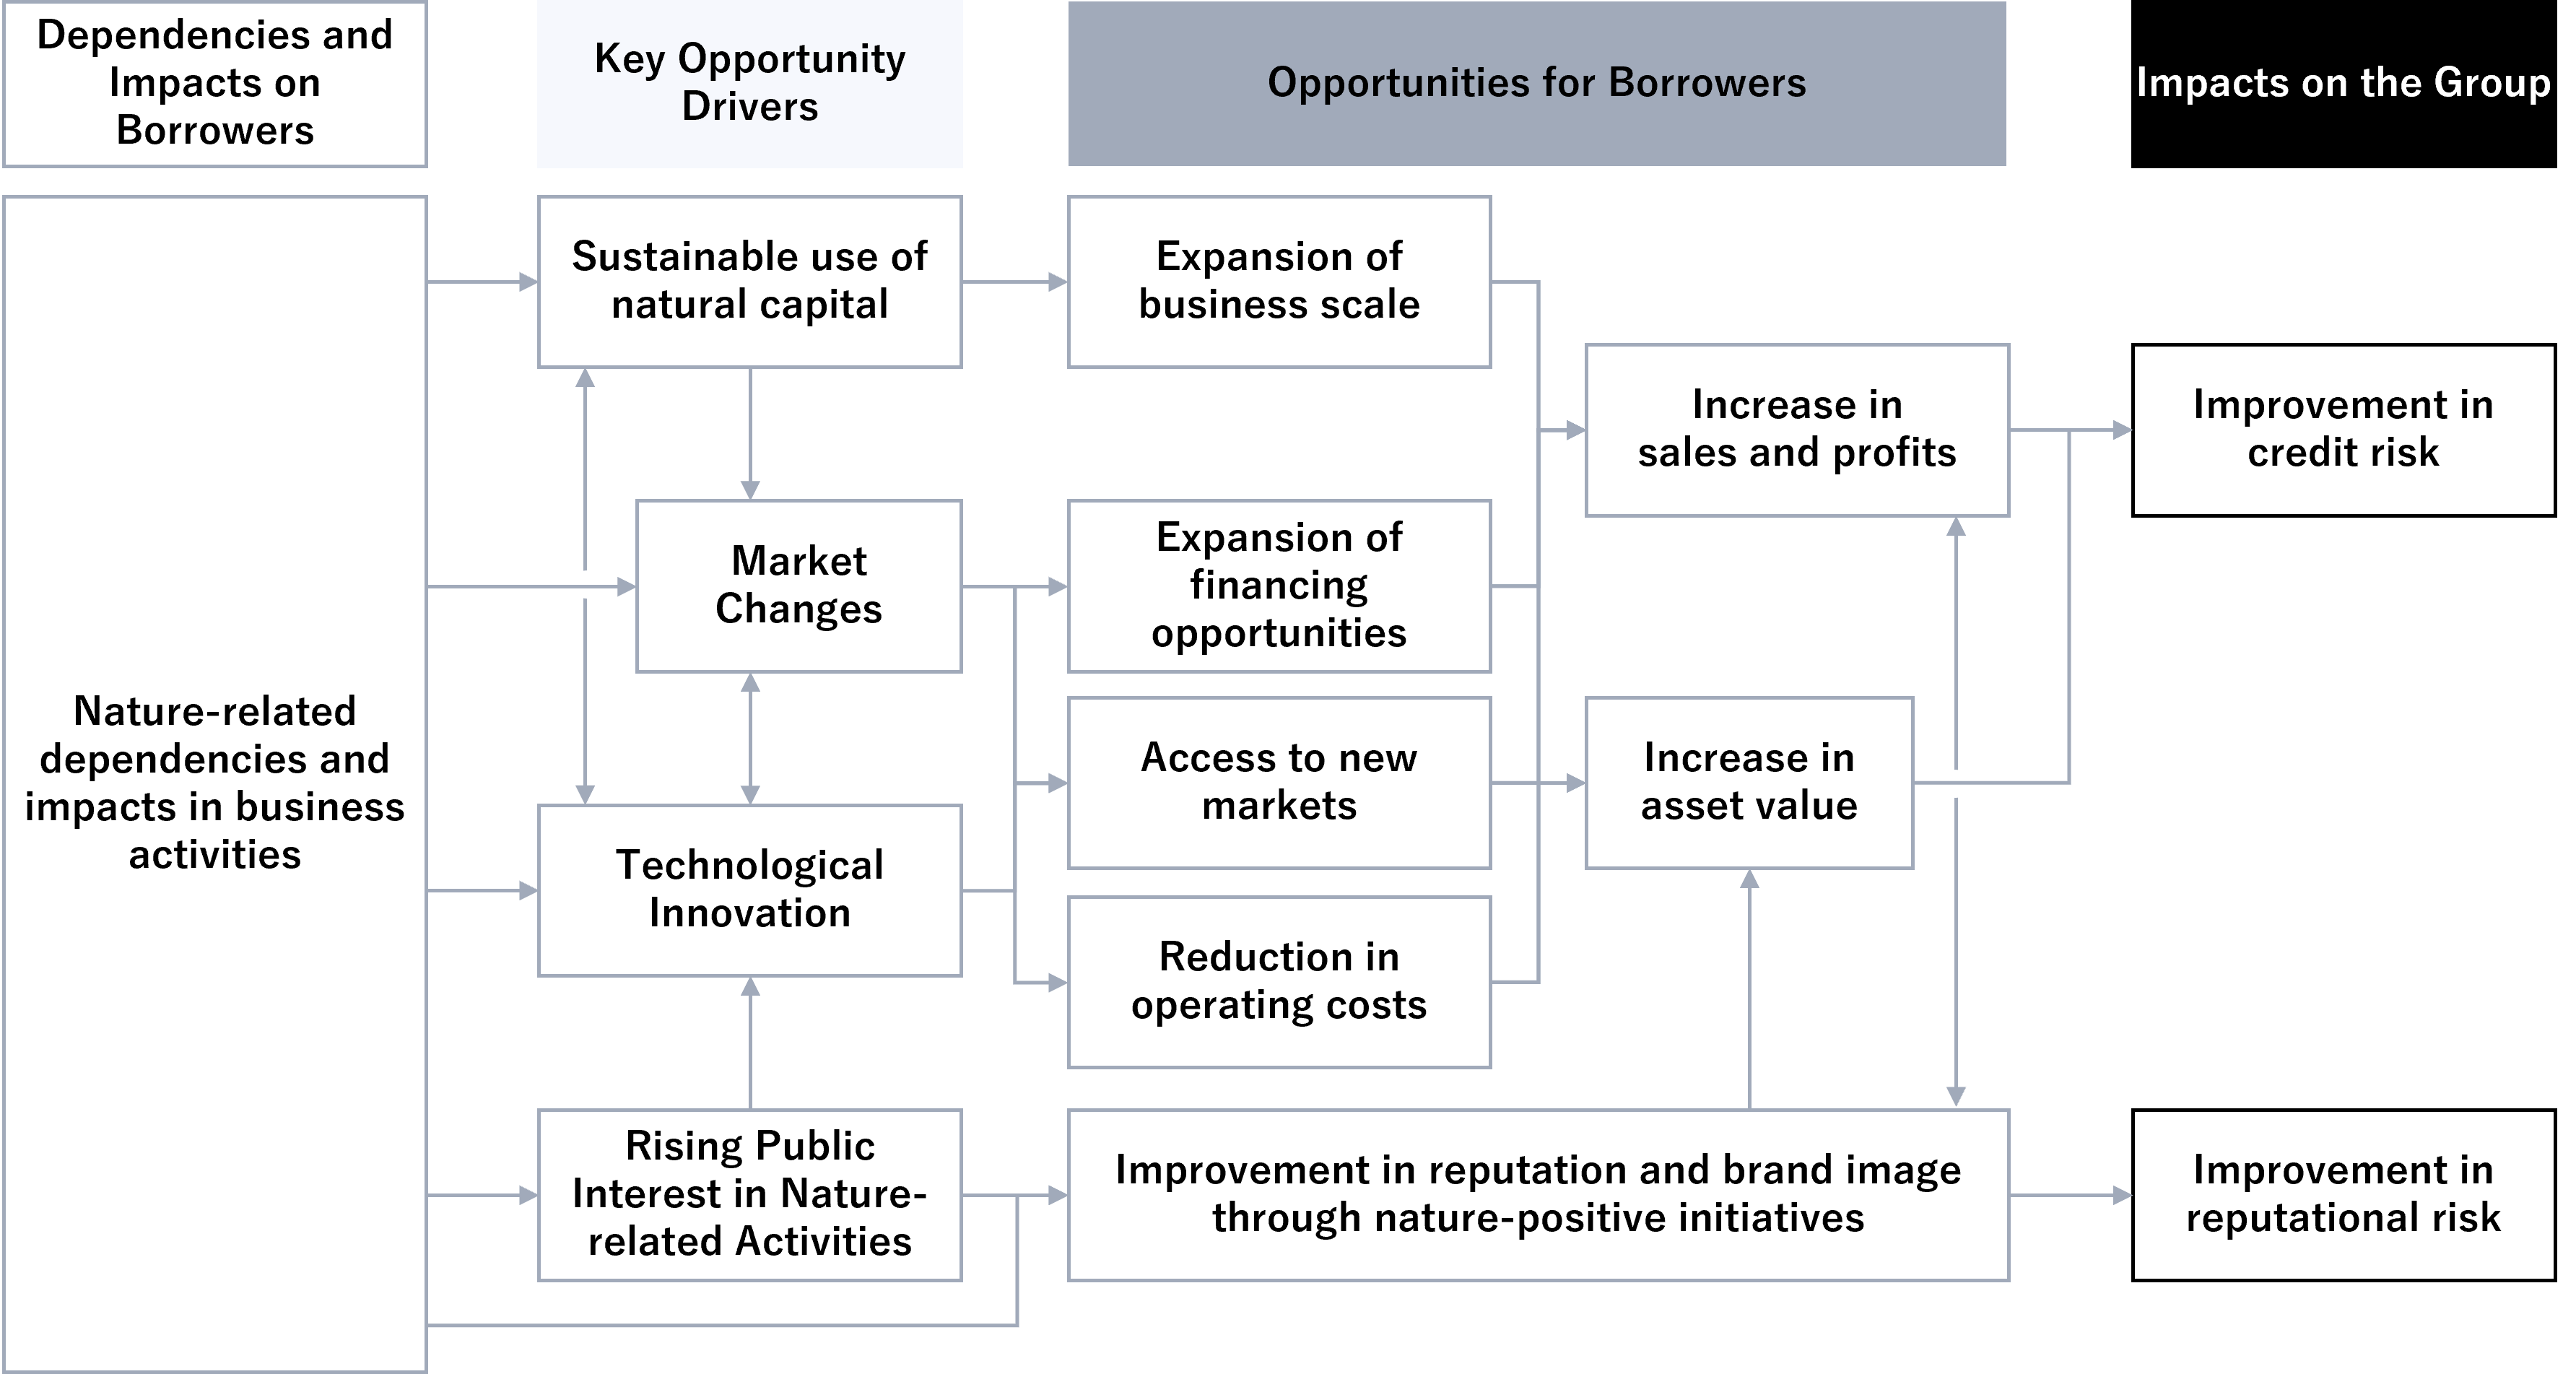
Overview of Key Opportunities
Details of Key Opportunities
|
Opportunity Type |
Category |
Key Dependencies (★) / Key Impacts (☆) |
Key Opportunities Derived from Dependencies and Impacts |
Likelihood |
|
|
Frequency*1 |
Time Horizon*2 |
||||
|
Business Performance |
Market |
☆ Resource use, pollution |
Adoption of low-impact technologies and products, enabling access to new markets |
Medium |
Long term |
|
Business Performance |
Market |
★☆ Overall |
Integration of nature-positive targets into strategy, improving ESG ratings, asset value, and access to green finance |
Medium |
Medium term |
|
Business Performance |
Market |
★ Flood and storm regulation |
Business continuity planning that incorporates natural disaster risks, reducing financial impacts |
Medium |
Medium term |
|
Business Performance |
Resource Efficiency |
☆ Resource use, pollution |
Reduced use and waste of resources, improving productivity and profitability |
Medium |
Long term |
|
Business Performance |
Products and Services |
☆ Resource use |
Development of recycled materials from waste and by-products, expanding access to new markets |
High |
Medium term |
|
Business Performance |
Products and Services |
☆ Resource use |
Sales of certified low-impact agricultural products and goods, increasing revenue opportunities |
Medium |
Long term |
|
Business Performance |
Products and Services |
☆ Resource use |
Substitution of inputs, reducing lifecycle impacts and creating additional revenue opportunities |
Medium |
Long term |
|
Business Performance |
Products and Services |
☆ Climate change, resource use, pollution |
Nature-positive initiatives, creating new financing opportunities such as carbon credits |
Medium |
Short term |
|
Business Performance |
Reputation Capital / Market |
★☆ Overall |
Transparent disclosure, enhancing brand value |
Medium |
Medium term |
|
Sustainability Performance |
Sustainable Use of Natural Resources |
☆ Resource use |
Adoption of sustainable materials and technologies, reducing environmental impacts |
Medium |
Medium term |
|
Sustainability Performance |
Ecosystem Protection, Restoration, and Regeneration |
☆ Land use, climate change, resource use, pollution |
Conservation efforts and support, enhancing sustainability performance |
Medium |
Long term |
- High: Likely to occur on an annual basis or more frequently; Medium: Likely to occur once every few years
- Short-term: less than 3 years; Medium-term: 3–10 years; Long-term: more than 10 years
Overall Risk and Opportunity Assessment
Physical risks identified include the impacts of reduced water availability and drought, particularly in sectors that rely heavily on water resources. In addition, natural hazards affecting operational sites—such as floods, storms, and landslides—have been identified as key risks, based on events such as the 2018 heavy rainfall disaster in Hiroshima.
Key transition risks include the tightening of regulations on hazardous substances used in business activities, as well as reputational damage and potential liabilities arising from inadequate management practices. These risks are particularly significant in regions where industries, including heavy industries, are concentrated around industrial complexes.
Key opportunities identified include improved resource efficiency, effective use of waste and by-products, expansion into certified-product markets, development of new products and services, access to sustainable financing methods such as green funds, and enhanced reputation through transparent disclosure.
Overall, these risks and opportunities are primarily related to credit risk and reputational risk.
We believe that engagement with local communities and stakeholders that coexist with nature and are deeply connected to it is essential to addressing nature-related issues.
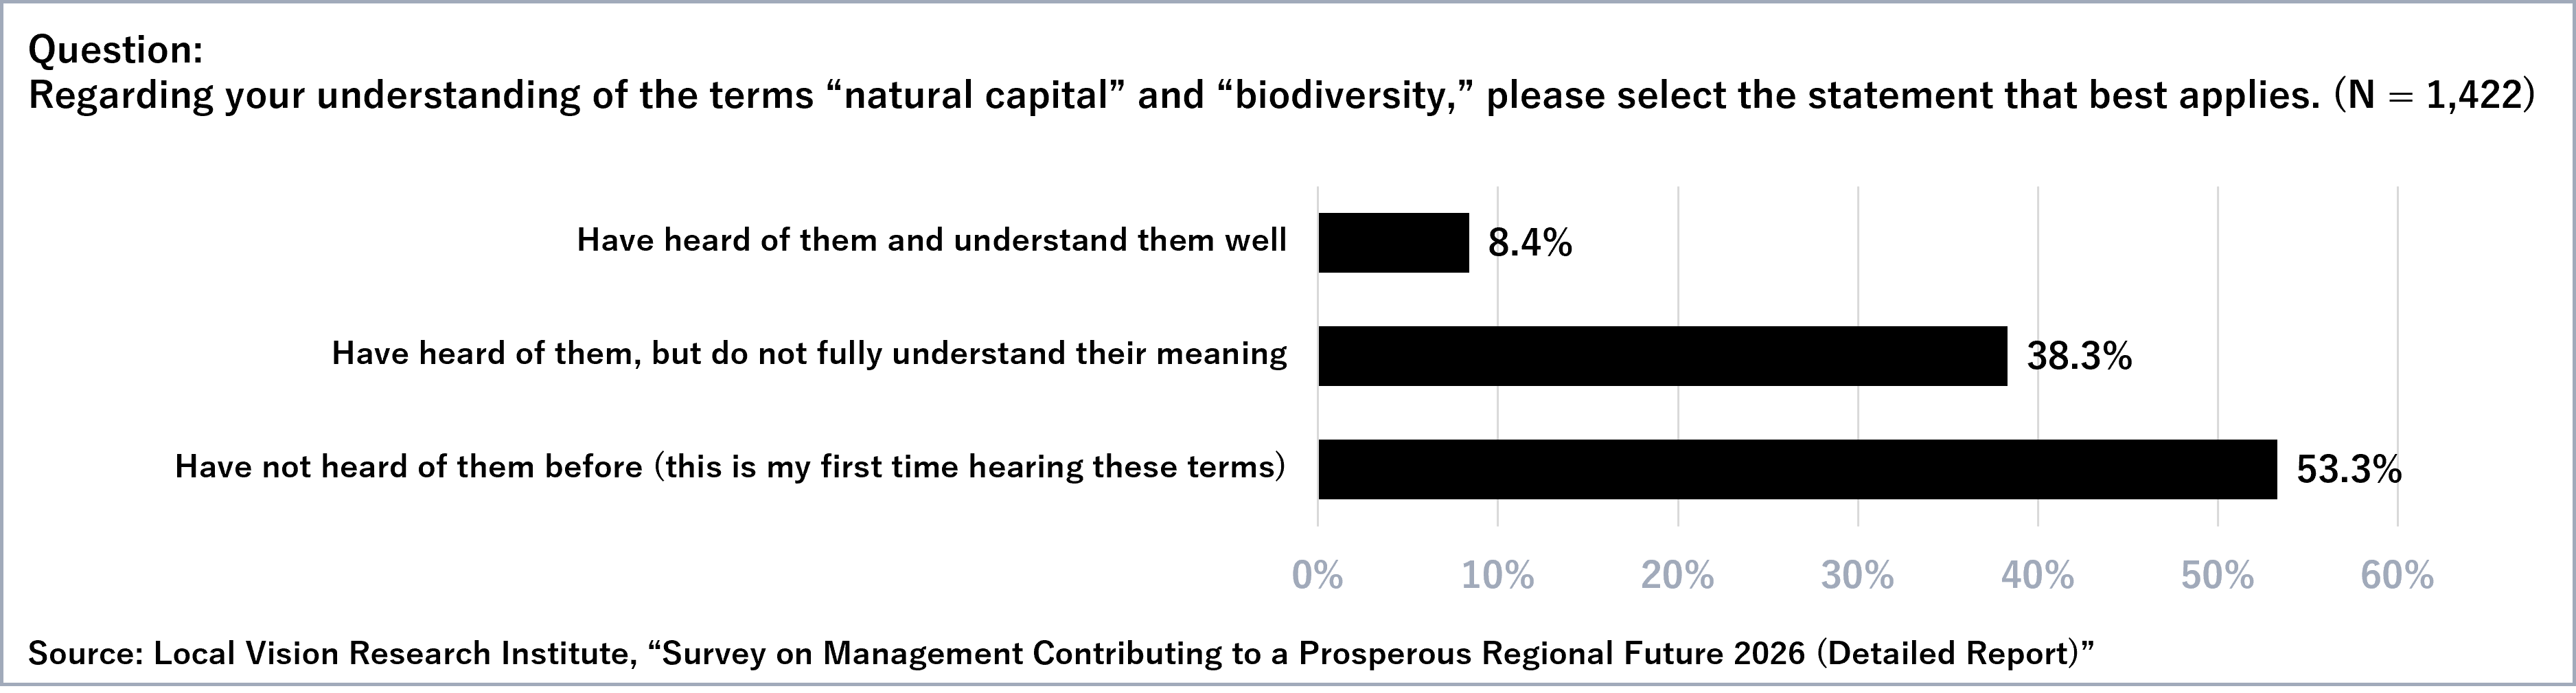
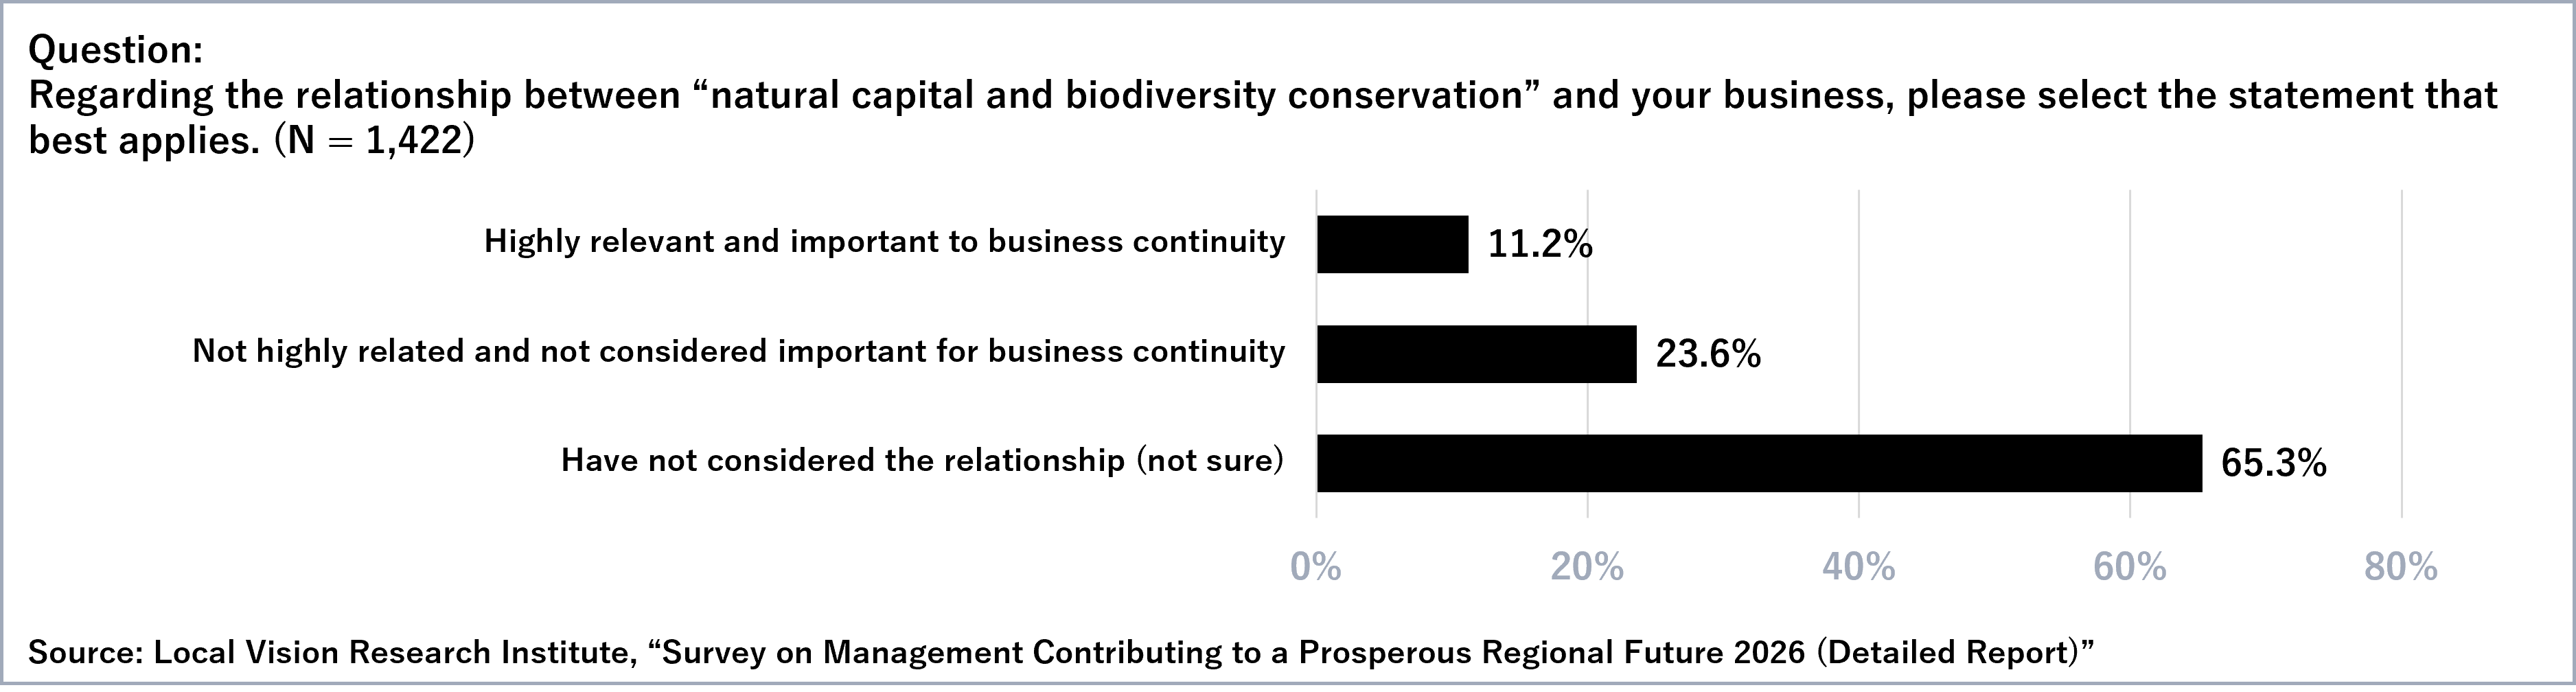
A survey* of regional companies conducted between January and February 2026 confirmed that, although awareness of the terms “natural capital” and “biodiversity” has increased to some extent, understanding of these concepts, recognition of the relationship between business and nature, and related initiatives remain limited.
Based on these findings, we will promote dialogue and provide information to help regional companies better understand the relationship between business activities and nature.
- Survey conducted by: Local Vision Research Institute (the Group collaborated with the Institute in designing the survey questionnaire and distributed the survey and requested responses from customers).